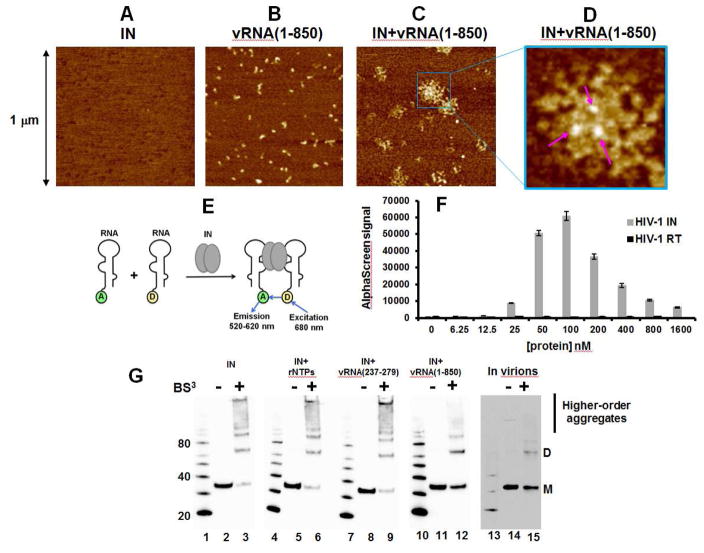
Figure 3. Biophysical analysis of IN-vRNA(1-850) complexes.
AFM images of SEC purified samples: IN alone (A), vRNA(1-850) alone (B) and IN+vRNA(1-850) (C and D). (D) The zoomed image of the box in (C) with arrows pointing to the bright spots corresponding to IN bound to vRNA(1-850). (E) The design of AlphaScreen-based RNA bridging assay (only IN dimer shown for simplicity). “A” and “D” indicate anti-DIG Acceptor and streptavidin coated Donor beads bound to either biotin or digoxin (DIG), respectively. (F) The results of the RNA bridging assay with 25 nM of total RNA incubated with indicated concentrations of IN and RT. The average values of three independent experiments and corresponding standard deviations are shown. (G) BS3 crosslinking to analyze the multimeric state of IN in the context of unliganded IN (lanes 2 and 3), IN+ribonucleotides mixture (rNTPs) (lanes 5 and 6), IN+vRNA(237-279)-DIS (lanes 8 and 9), and IN+vRNA(1-850) (lanes 11 and 12) in vitro compared to the multimeric states of IN in virions of HIV-1NL4-3 (lanes 14 and 15). Positions of monomeric (M) and dimeric (D) forms as well as higher-order aggregates are indicated.

