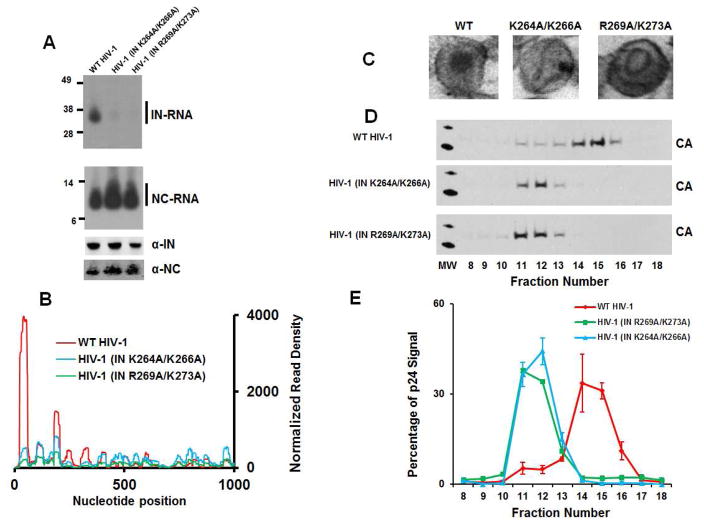
Figure 6. Characterization of mutant viruses.
(A) Autoradiograms of IN-RNA and NC-RNA crosslinked adducts from WT HIV-1NL4-3, HIV-1NL4-3 IN(K264A/K266A) and HIV-1NL4-3 IN(R269A/K273A) virions (upper two panels). Corresponding western blot analysis of IN and NC in immunoprecipitated fractions (lower two panels). (B) CLIP-seq results for IN-viral RNA crosslinks from WT HIV-1NL4-3, HIV-1NL4-3 IN(K264A/K266A) and HIV-1NL4-3 IN(R269A/K273A) virions (only the first 1000 nucleotides shown). (C) Representative EM images of virions from WT HIV-1NL4-3, HIV-1NL4-3 IN(K264A/K266A) and HIV-1NL4-3 IN(R269A/K273A). (D) Sucrose density gradient separation of capsid cores from detergent-lysed virions of WT HIV-1NL4-3, HIV-1NL4-3 IN(K264A/K266A) and HIV-1NL4-3 IN(R269A/K273A). (E) Quantitation of triplicate experiments of HIV-1 CA-p24 signal intensity from (D) using ImageJ software. The error bars indicate standard deviations.

