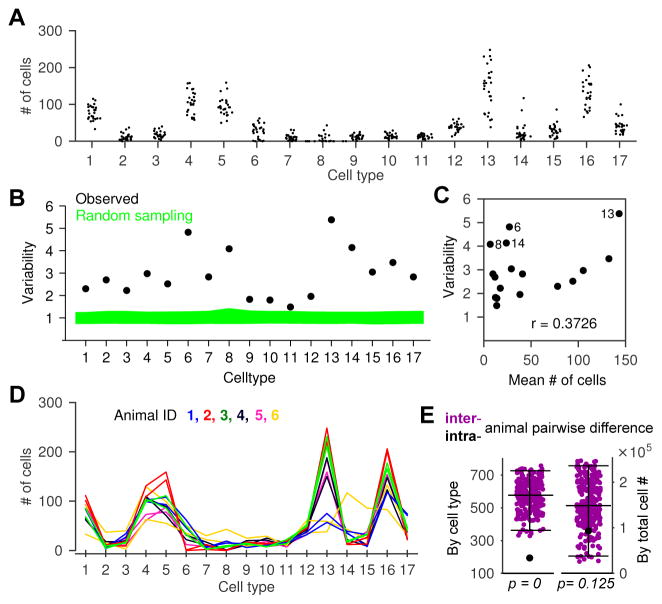
Figure 2. Individual mice exhibited non-stochastic variability in VSN functional types.
(A) Cell counts of each VSN functional type in each imaging volume.
(B) Cell count variability (see Experimental Procedures) of each type in all imaging volumes. Green represents the 95% confidence interval if cell numbers are drawn from a multinomial distribution.
(C) Variability was not correlated with cell abundance, r: Pearson’s correlation coefficient (p=0.14).
(D) Pairs of imaging volumes recorded from the same animals. Each color represents one animal, and the two lines with the same color are the two non-overlapping imaging volumes from the same animal.
(E) Left (by cell type): summed difference of intra-animal pairs (●) was smaller than that of any combination of inter-animal pairs (●, all 265 possible permutations of pairs in E are shown). Right (by total cell #): intra-animal difference (●) is not significantly smaller than all possible inter-animal differences ●.
Error bars represent 95% confidence interval.
See also Figure S2.

