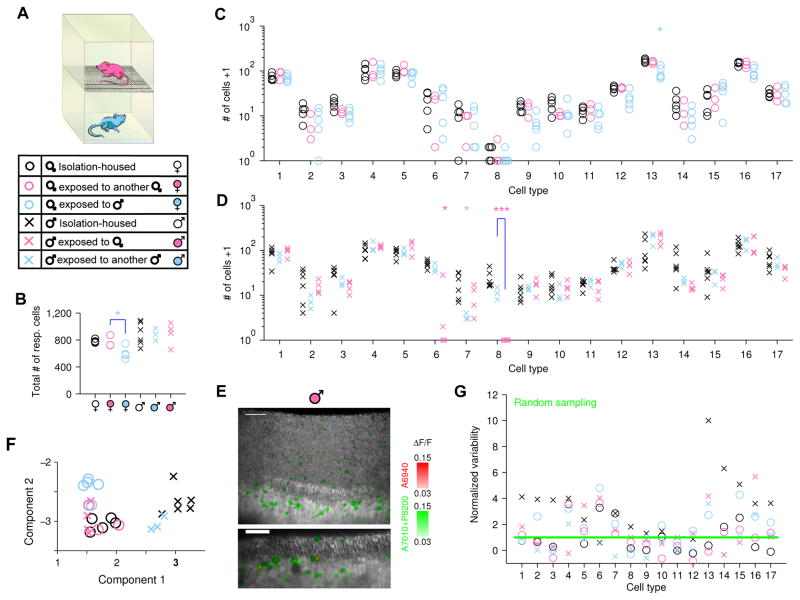
Figure 4. Exposure to female scents triggers the disappearance of the male-specific VSN type.
(A) Stacked cages provide chronic exposure to chemical social cues without permitting aggressive encounters or mating. Six groups of animals with varied sex and social cue experience are represented by different markers throughout the figure.
(B–D) Number of cells in VNO imaging volume from mice with different olfactory experiences (see 6 groups in A). B, total number of cells responding to sulfated steroids; C &D, number of cells in each specific VSN functional type. Type-8 cells showed a dramatic decrease in abundance in males exposed to females compared to males exposed to other males (p=7.0×10⁻⁵, Students’ t-test, significance tested with Ŝidák correction for multiple comparison). Statistical tests were performed for all conditions against isolation-housed animals and also between groups with same- and opposite-sex experience. ***: p<0.001; *: p<0.05 (the latter not significant when corrected for multiple comparisons).
(E) Three-dimensional rendering (upper) and two-dimensional slice (lower) of a VNO imaging volume from a male mouse exposed to a female. Coloration is identical to Figure 3C&D. The absence of red cells indicates the absence of type-8 VSNs, in contrast with isolation-housed males in Figure 3C and male-exposed males (see also Movie S3, 5 & 6). Scale bar, 50 μm.
(F) Whole-animal view of VNO cell-type composition from mice with different sexes and experiences. A linear-discriminant projection onto the two components with largest eigenvalues are shown. Isolation-housed males (×) and females (○) were well separated; males exposed to female cues (×) would be grouped with females (note overlap with circles).
(G) Normalized variability for each group of mice with the same sex and experience. For the 6 groups of animals, the numbers of cell types with variability consistent with random sampling (below the 95% confidence level marked by the green line) were 3 (×), 11 (○), 5 (°), 8 (°), 12 (×) and 9 (×) out of 17 types.

