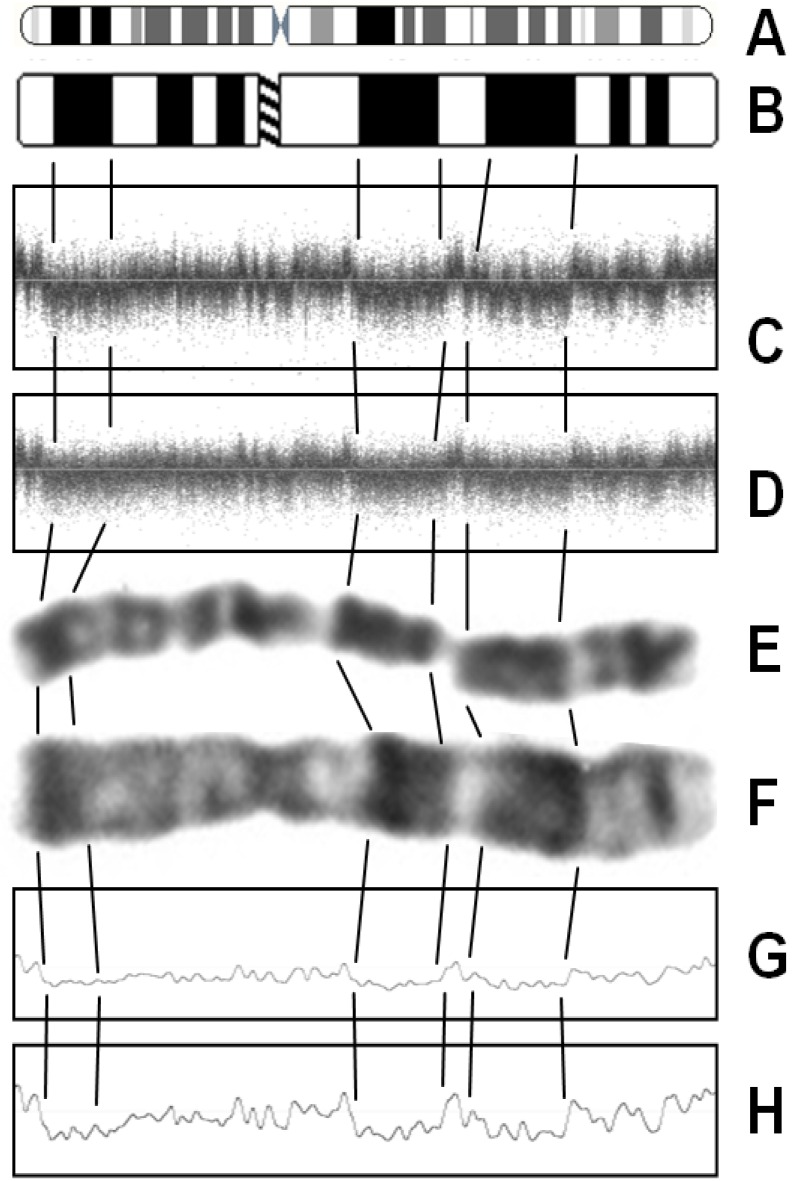
Figure 2.
Wave noise. Ideograms of pro-metaphase (A) and metaphase (B) chromosome 7 were compared with signal intensities of SNPs of chromosome 7 of two patients (C,D) and with a human prometaphase (E) and metaphase (F) chromosome 7. Signal intensities shown in C and D were smoothed (noise-free-cnv software, function “blur” across 1,000 probe sets) to visualize genomic waves (G,H).

