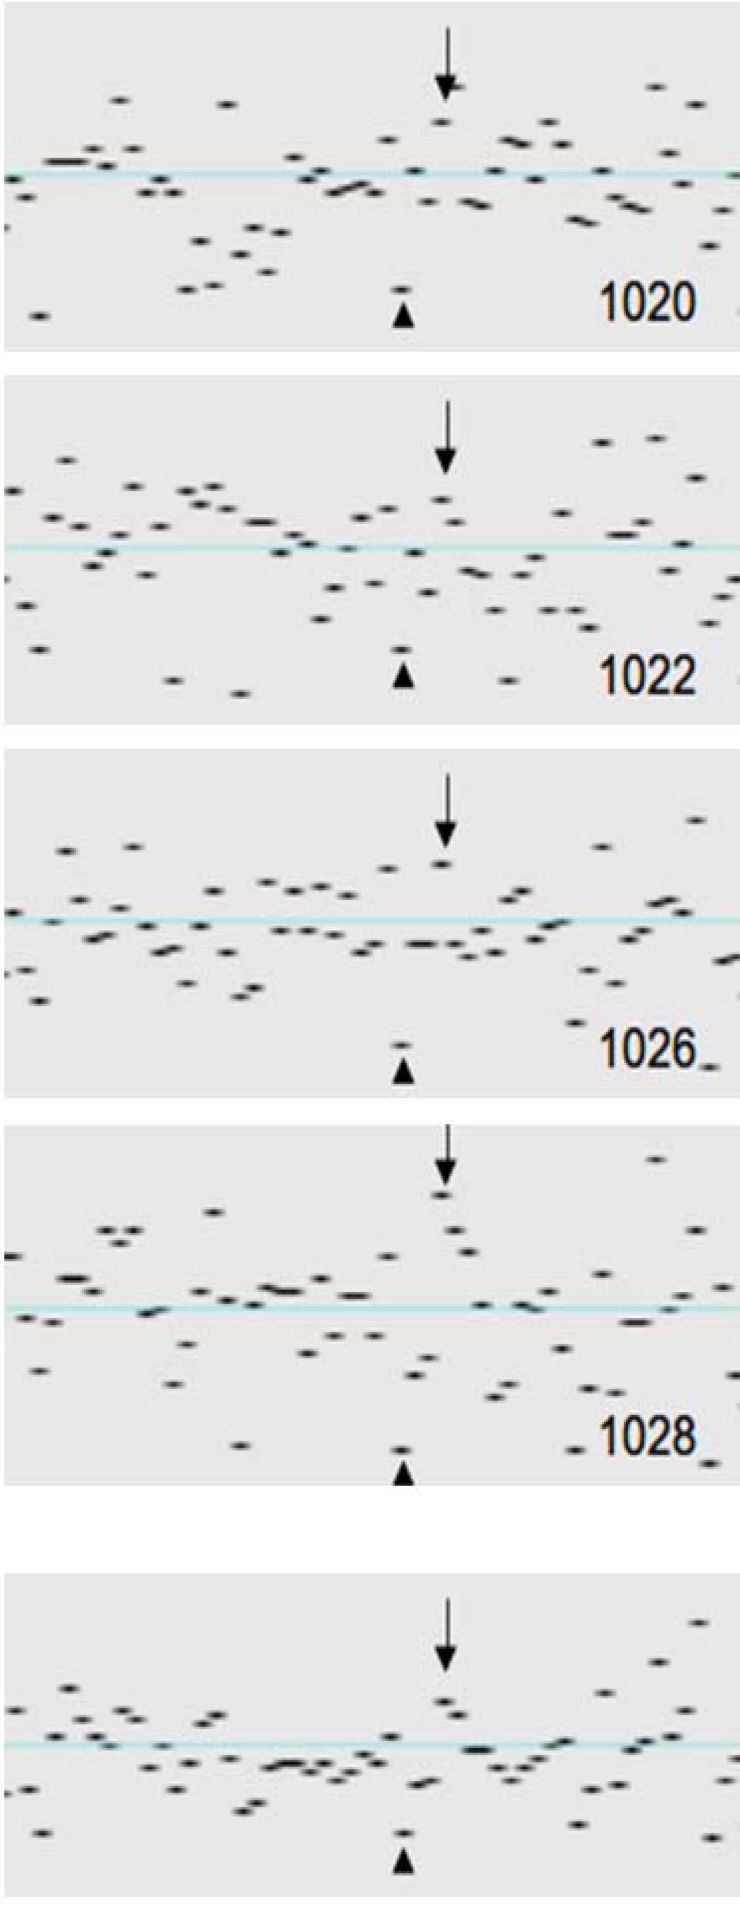
Figure 4.
per-SNP system noise. Signal intensities in genomic region 2: 189766706–189891527 shown for four patients (ID 1020; ID 1022; ID1026; ID 1028). The lower panel shows the per-SNP median profile (median signal intensities) of all samples (n = 77). Arrows and arrowheads indicate SNPs with LRR values far above and below the mean.

