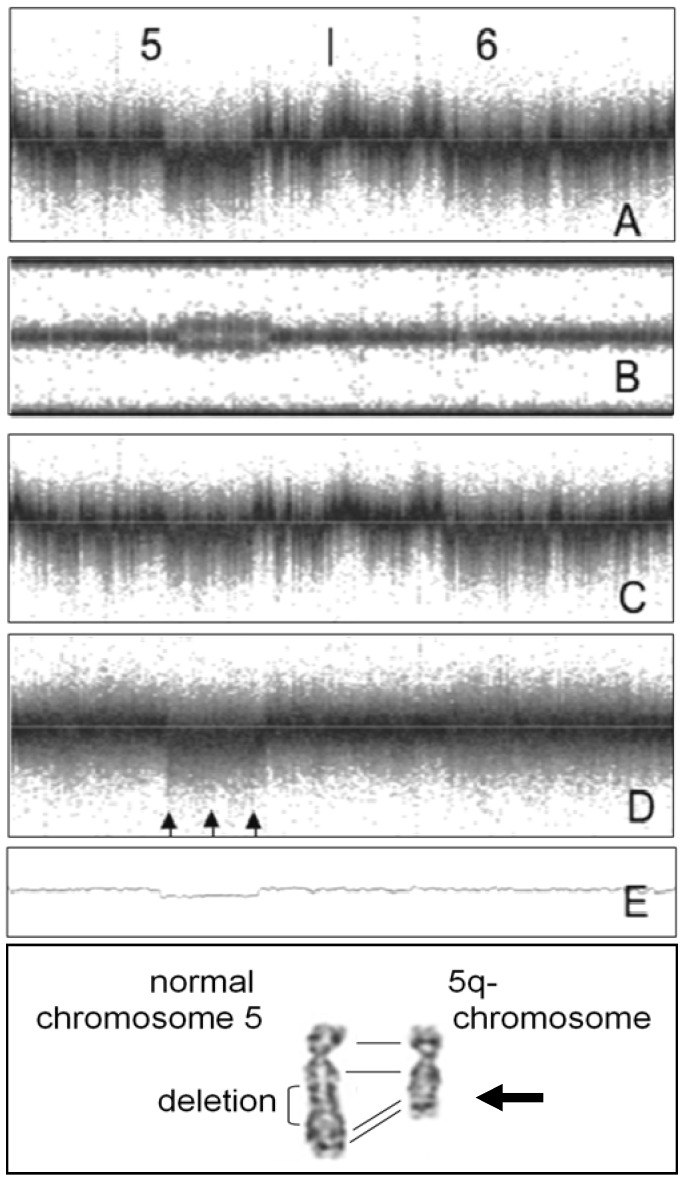
Figure 8.
Sample with mosaic large deletion in chromosome 5q. (A,B) LRR- and BAF-values of SNPs of chromosomes 5 and 6 of patient. (C) LRR values of reference sample. (D) Signal intensities after subtraction of reference sample. Arrows indicate region with reduced LRR values. (E) LRR values after application of noise-free-cnv blur over 2,000 SNPs. (Bottom panel) Chromosome analysis of cultured peripheral blood lymphocytes from patient (courtesy of Johannes W.G. Janssen, Department of Human Genetics, University of Heidelberg). Arrow points to 5q-minus chromosome.

