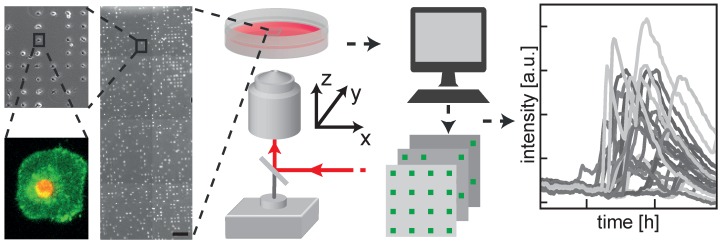
Figure 1.
Protein-coated arrays are generated following plasma-induced patterning of -dishes. Cells distribute themselves on the patterned sites of an array after seeding. They are then exposed to NPs and monitored for activation of fluorescent markers of cell death for up to 72 h using an automated fluorescence microscope. The ease of automated image processing on the cell lattice enables high-throughput analysis of the kinetics of single-cell fluorescence. Scale bar: 500 m (close-ups 5× and 25× magnified, respectively).

