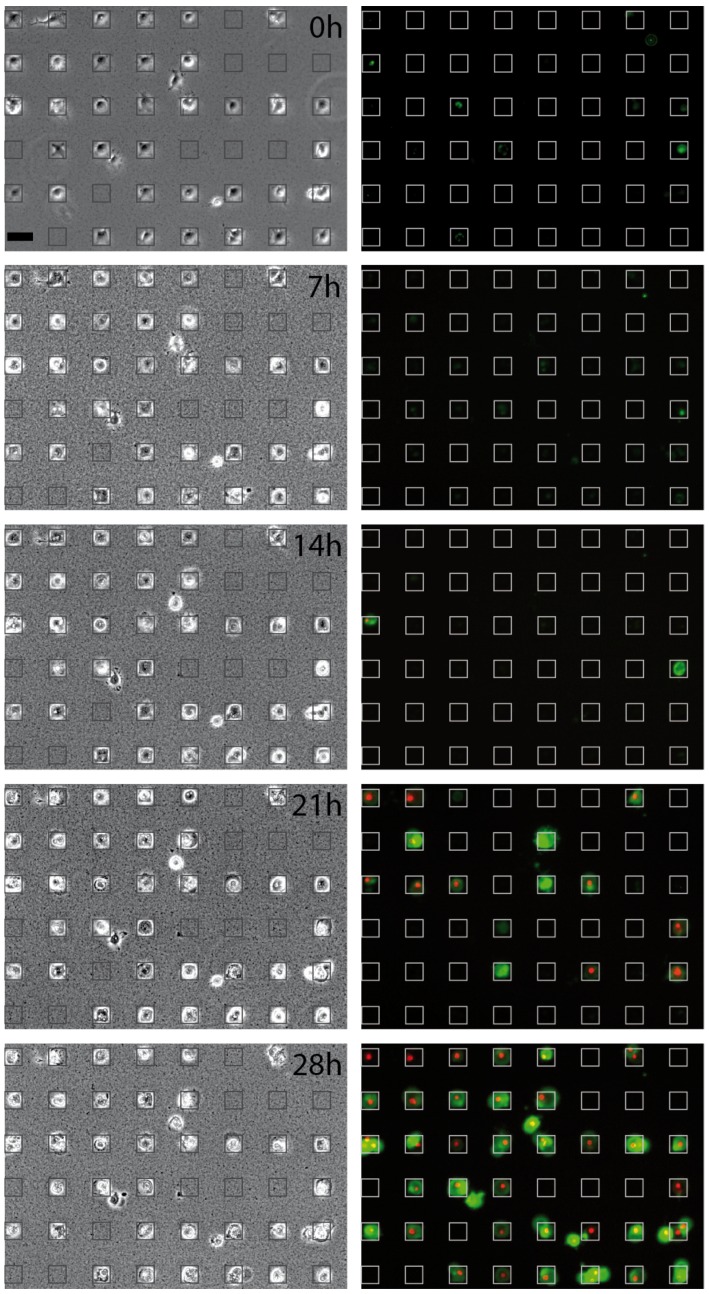
Figure 2.
Time series of apoptotic events induced by -NPs monitored by brightfield illumination and fluorescence imaging at 0, 7, 14, 21 and 28 h after seeding. The graininess seen in the brightfield images is attributed to sedimentation of nanoparticle (NP) aggregates. In the fluorescence images, green staining (pSIVA-IANBD) indicates exposure of phosphatidylserine (PhS) on the outer leaf of the plasma membrane bilayer, the red nuclear staining (PI) indicates subsequent loss of plasma membrane integrity. The heterogeneity in the times of onset of apoptosis can be clearly seen. Square lattices are drawn for better visualization. Scale bar: 50 m.

