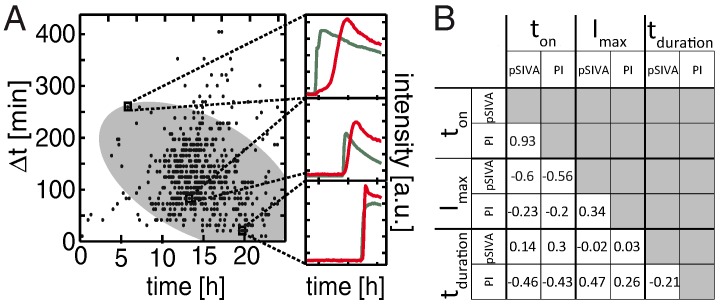
Figure 5.
(A) The interval separating early-stage apoptosis (only pSIVA) from secondary necrosis (pSIVA+PI) varies depending on the onset time of apoptosis. This time difference is plotted against the onset time. The grey ellipse represents a 2 interval of a principal component analysis (PCA). Three representative time traces of apoptotic cells are depicted for better visualization: Cells that die at later time-points transit faster into secondary necrosis; (B) Different parameters of apoptotic cells are extracted from the time traces and displayed as a correlation matrix: onset times , maximum intensity and duration of onset for pSIVA and PI. Maximal pSIVA intensity , and duration (spread) of onset time of PI are negatively correlated with the onset of apoptosis.

