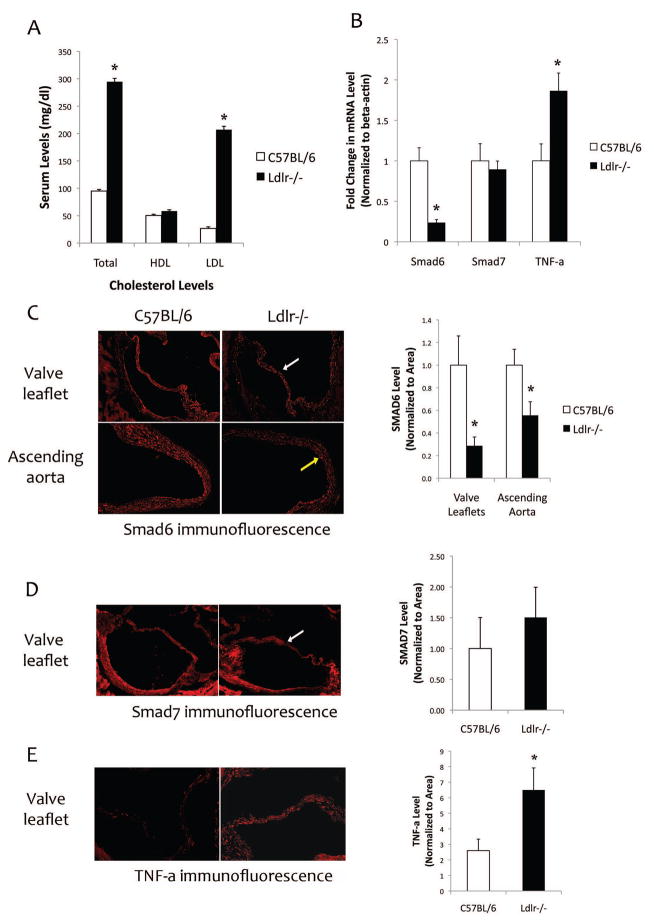
Figure 1. Expression of I-Smads and TNF-a in aortic tissues of normolipemic and hyperlipidemic mice.
(A) Serum cholesterol levels of C57BL/6 and Ldlr−/− mice. (B) Realtime RT-qPCR analysis of aortic tissues from C57BL/6 and Ldlr−/− mice for Smad6, Smad7, and TNF-a expression. *p < 0.05 vs. respective C57BL/6 controls. (C) Left - Immunofluorescence images of aortic valve leaflets (white arrow) and aorta (yellow arrow) from C57BL/6 (n = 7) and Ldlr−/− (n= 7) mice for Smad6. Magnification: 10X. Right - Quantitation of the images (normalized per tissue area) using image analysis software (Metamorph Advanced v7.7). *p < 0.05 vs. respective C57BL/6 controls. (D) Left - Immunofluorescence images of aortic valve leaflets (white arrow) from C57BL/6 (n = 6) and Ldlr−/− (n= 6) mice for Smad7. Right - Quantitation of the images (normalized per tissue area) using the image analysis software. (E) Left - Immunofluorescence images of aortic valve leaflets from C57BL/6 (n = 7) and Ldlr−/− (n= 7) mice for TNF-a. Right - Quantitation of the images (normalized per tissue area) using the image analysis software. *p < 0.05 vs. respective C57BL/6 controls.

