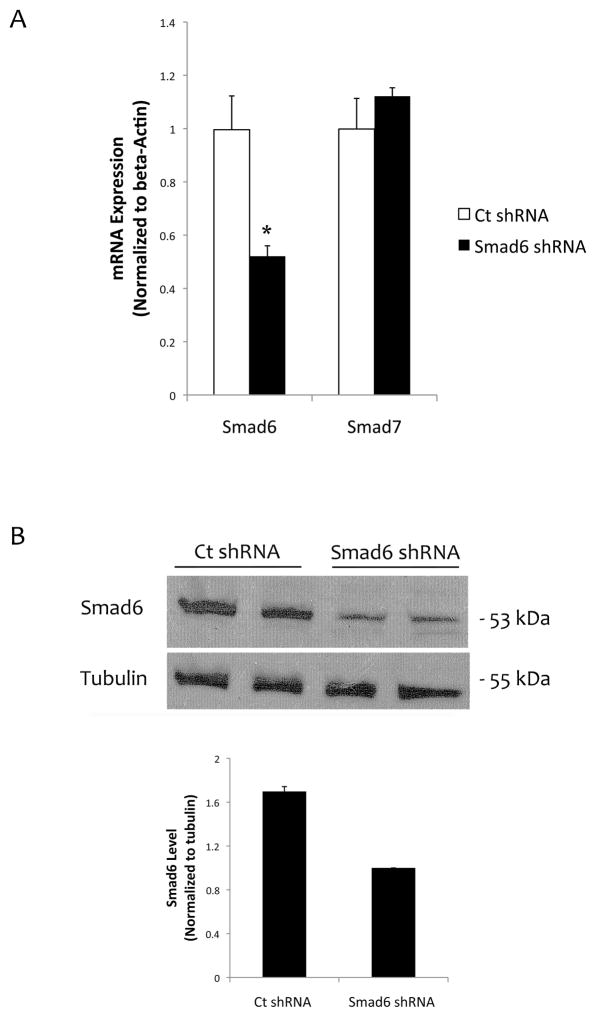
Figure 4. Knocking down Smad6 in mVICs.
(A) Realtime RT-qPCR analysis for Smad6 and Smad7 expression in mVICs transfected with control shRNA or Smad6 shRNA. *p < 0.05 vs. respective control. (B) Western analysis of cell lysates from mVICs transfected with control shRNA or Smad6 shRNA. Tubulin was used as a loading control. Quantitative analysis of the lanes via NIH Image J v64 is shown in a graph.

