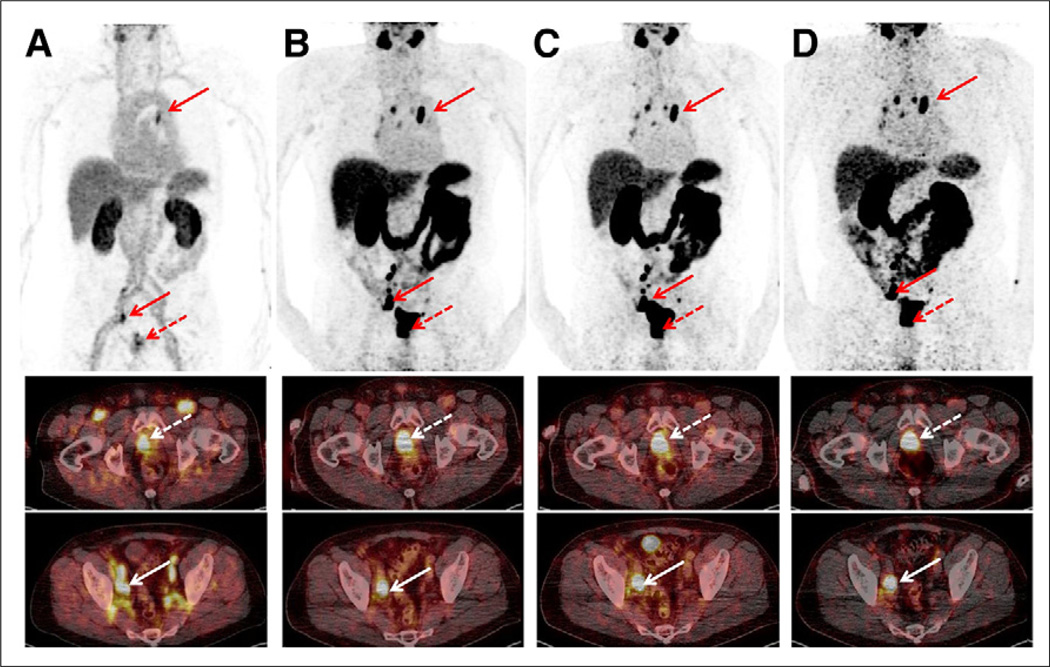
FIGURE 1.
Sequential scan of 70-y-old patient (P3; PSA level, 101.2 ng/mL) with initial diagnosis of prostate cancer (dotted arrow) showing high tumor-to-background ratio. Maximum-intensity projections (upper row) and axial slices (middle and lower rows) at different time points are displayed ([A] early rapid scan, [B] 1-h scan, [C] 2-h scan, [D] 4-h scan). Primary prostate cancer (middle row; 1-h SUVmax, 55.0) as well as numerous iliacal (lower row; 1-h SUVmax, 57.0) and mediastinal lymph node metastases (upper row; 1-h SUVmax, 31.4) can be depicted immediately after injection and up to 4 h.

