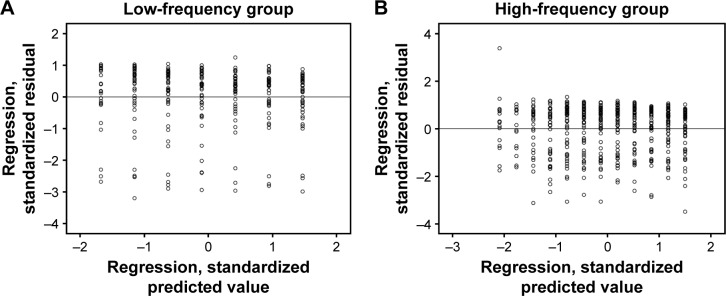
Figure 2.
Scatterplot represents standardized residual plot (ZPRED on X axis and ZRESID on Y axis) of (A) low- frequency group and (B) high-frequency group. The dependent variable is mean defect for both groups.
Abbreviations: ZPRED, regression standardized predicted; ZRESID, regression standardized residual.

