
Figure 13.
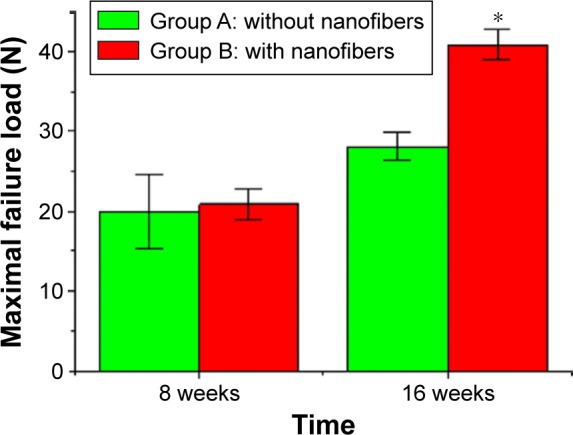
The comparisons of average maximal failure loads for the tendon pullout test between group A and group B.
Notes: The average maximal failure load of group B was 41.4 N (37.4–44.5 N), which was significantly greater than that of group A (28.3 N; 26.1–30.5 N) at 16 weeks. *P<0.05.