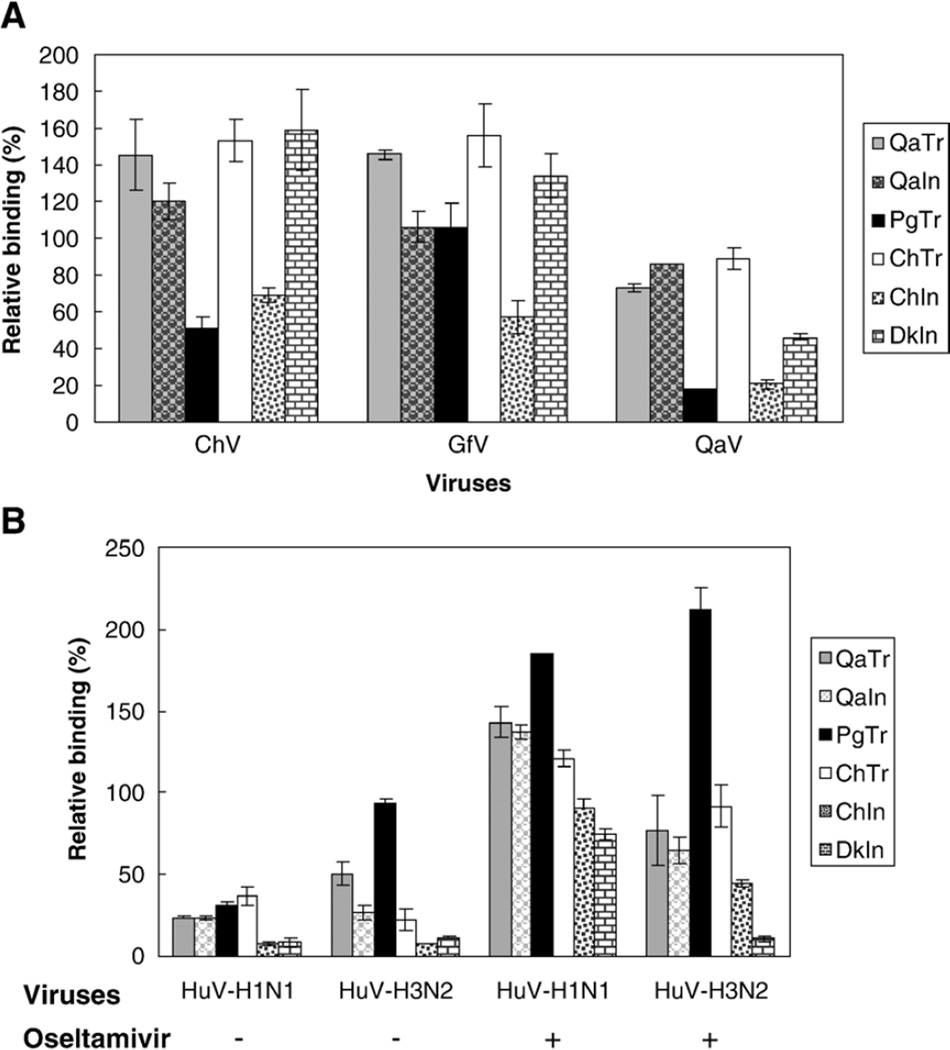
Fig. 5.
Relative binding of influenza viruses to plasma membranes from quail, pigs, chickens and ducks. (A) The viruses used are represented in the x axis (from left to right) as A/Chicken/Hong Kong/G9/97 (H9N2) (ChV), A/Guinea fowl/Hong Kong/WF10/99 (H9N2) (GfV), A/Quail/Hong Kong/A28945/88 (H9N2) (QaV). (B) The x axis represents A/New Caledonia/20/99 (H1N1), (HuV-H1N1) and A/Panama/2007/99 (H3N2), (HuV–H3N2). Plasma membranes of epithelial cells from different animal species and tissues were used including quail trachea (QaTr), quail intestine (QaIn), pig trachea (PgTr), chicken trachea (ChTr), chicken intestine (ChIn) and duck intestine (DkIn). The y axis represents percentages of OD450 values normalized to that of nonspecific adsorption, with the value of negative controls being subtracted for each tissue, respectively. Each bar is a mean of two assays with each sample run in duplicates. In panel B, the first two sets on the left represent the data of relative binding without Oseltamivir, while the third and fourth sets represent data from the assays in which 1 µM Oseltamivir was applied in the reaction buffer for diluting viruses.

