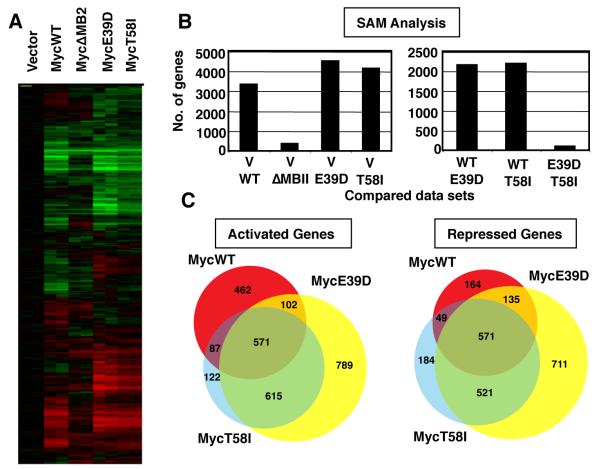
Figure 2. The BL-associated mutants, MycE39D and MycT58I, have a highly similar set of target genes which is significantly different from MycWT target genes.
A) myc−/− fibroblasts were engineered to express MycWT, a transactivation defective mutant MycΔMB2, or the indicated BL-associated Myc mutants. RNA was extracted from two independent polyclonal cell populations expressing the indicated Myc protein or vector control. Expression microarrays were performed using Agilent 4X44K Whole Rat genome microarrays. The figure shows the clustered heat map of all genes with signals 1.5 fold above background and normalized to vector control. B) Significance Analysis of Microarray (SAM) analysis was performed to compare the number of genes that were differentially regulated between the cell lines expressing the Myc proteins and vector control (left panel), and between the cell lines expressing the different Myc proteins (right panel). C) Venn diagram representing target gene overlap of MycWT and BL-associated mutants for genes up-regulated or down-regulated 1.5-fold over vector.

