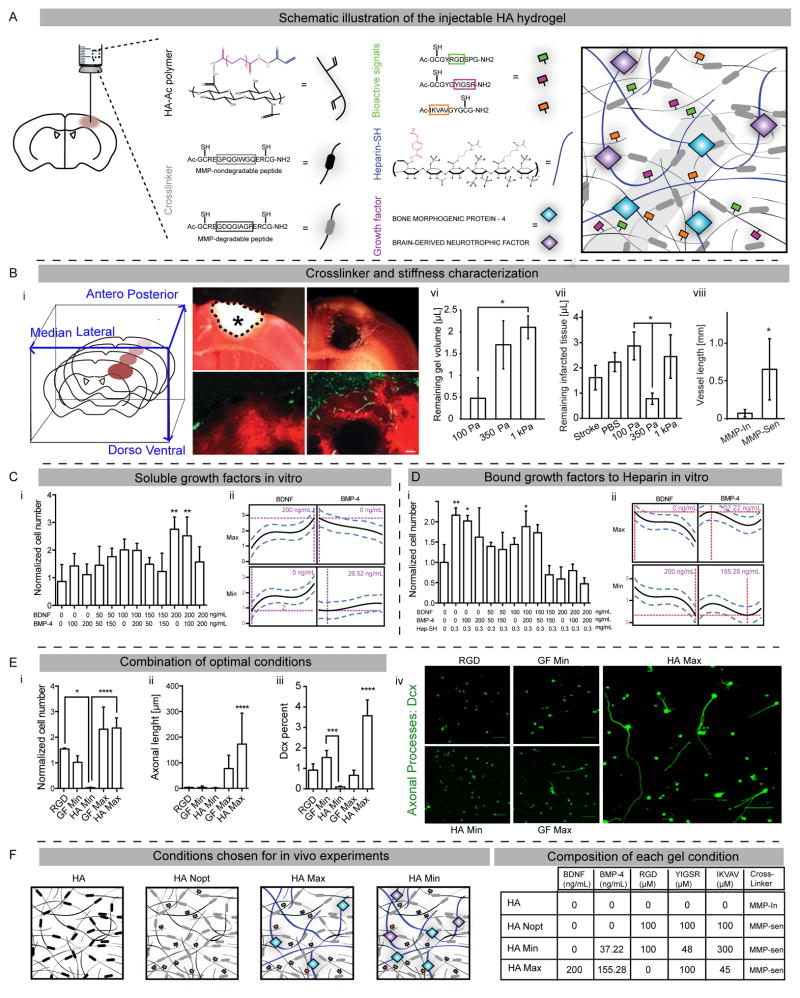
Figure 1. Mechanical and composition gel optimization.
(A) Schematic illustration of the injectable hyaluronic acid (HA) composed of acrylated hyaluronic acid, MMP degradable or non-degradable motifs, adhesion peptides and heparin bound growth factors. (B) Characterization of stiffness and crosslinker. (Bi) Schematic illustration of brain coronal sections and their orientations. The stroke cavity is represented by the asterisk. (Bii, Biii) TTC-stained brain sections showing infarcted tissue (delimitated by dotted line) without (Bii) and with (Biii) injection of a 350 Pa gel in the stroke cavity. (Biv, Bv) Vascular laminin staining (green) in HA gel (red) at 2 weeks post-injection with an MMP insensitive (or MMP-In; Biv) or sensitive (or MMP-Sen; Bv) cross-linker. (Bvi) Quantification of gel volume, (Bvii) infarcted tissue and (Bviii) the vascular density in the injected HA gels. DOE approach to optimize concentrations of (C) soluble or (D) bound growth factors. iPS-NPCs survival in HA gel at 1 week in response to varying concentrations of (Ci) soluble or (Di) bound growth factors. DOE prediction for the maximized and minimized cell proliferation for (Cii) soluble and (Dii) bound growth factors. (E) Combining optimal growth factor concentrations. (Ei) iPS-NPCs survival, (Eii) sprouting (Dcx staining) and (Eiii, Eiv) differentiation (% of Dcx cells by flow cytometry) in the combined optimization HA Max and HA Min at 1 week. (F) Schematics of the final optimized condition for in vivo testing and table of the gel component concentration. HA Nopt demonstrates non-optimized gel with equimolar concentrations of adhesion motifs and no GFs. Scale bars represent 1 mm (Bii, Biii), 100 μm (Biv, Bv) and 50 μm (Eiv). *, ** and *** indicate P < 0.05, P < 0.01 and P < 0.001, respectively.

