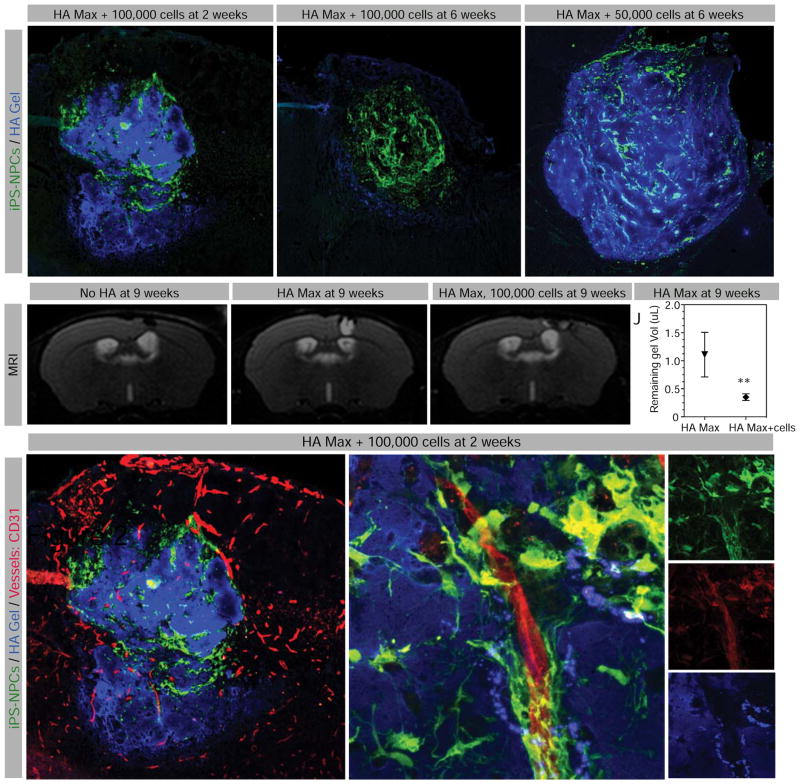
Figure 2. Biomaterial infiltration and resorption in vivo.
Fluorescent image of stroke area (A) 2 weeks and (B) 6 weeks after transplantation with 100,000 iPS-NPCs (green) encapsulated in HA Max (blue), or (C) 6 weeks after transplantation of 50,000 iPS-NPCs encapsulated in HA Max. (D) Brain MRI images of animals at 9 weeks after stroke (dashed rectangle), (E) stroke plus HA Max injection and (F) stroke plus transplantation of 100,000 cells encapsulated in HA Max. (J) Quantification of gel representing T2 signal (arrowhead in E and F). (K) Fluorescent staining of vascular growth within HA Max at two weeks after transplantation, where the area demarcated in dashed line is magnified in L (merged), M (transplanted cells, in green), N (CD31 positive endothelial cells, in red) and O (gel, in blue). Scale bar represents 100 μm (A–C) and 10 μm (K–H). ** indicates P < 0.01.

