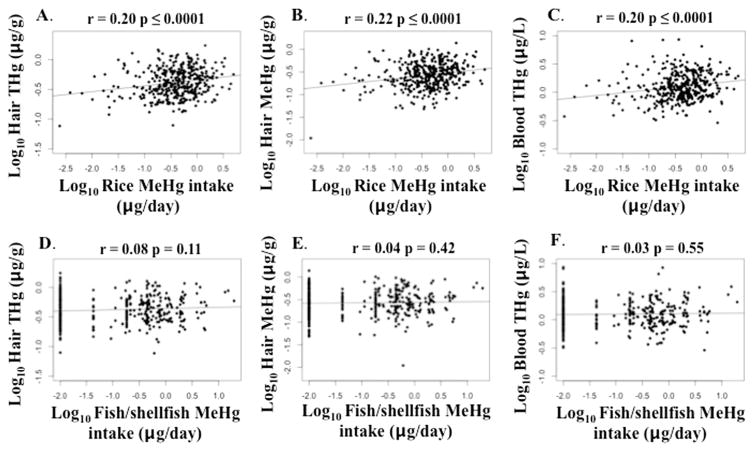
Fig. 2.
Bivariate scatterplots relating biomarker concentrations of total mercury (THg) and methylmercury (MeHg) to dietary MeHg intake through rice ingestion (A–C) and fish/shellfish consumption (D–F), including A) hair THg versus rice MeHg intake, B) hair MeHg versus rice MeHg intake, C) blood THg versus rice MeHg intake, D) hair THg versus fish/shellfish MeHg intake, E) hair MeHg versus fish/shellfish MeHg intake, and F) blood THg versus fish/shellfish MeHg intake (all variables log10-transformed), including p-values for Pearson’s correlation (n=397–398 mothers).

