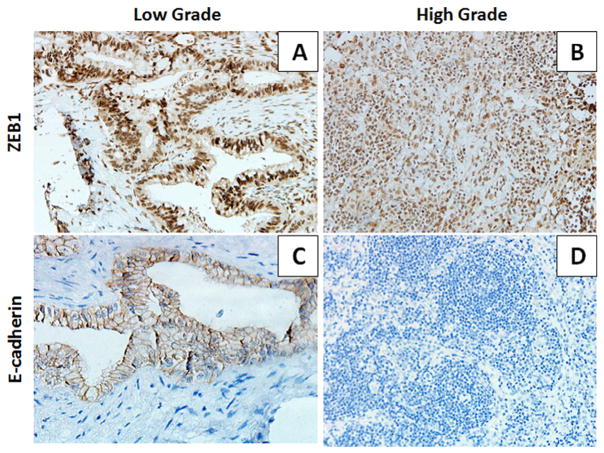
Fig. 4.
Expression and subcellular localization of ZEB1 and E-cadherin in PDACs. Anti-ZEB1 and anti-E-cadherin antibodies were used for IHC analysis of grade 1 and grade 2 tumors. Images are representative of ZEB1 and E-cadherin expression. (A) Low-magnification image of ZEB1 expression in grade 1 tumors. (B) Low-magnification image of ZEB1 expression in grade 2 tumors. (C) Low magnification image of E-cadherin expression in grade 1 tumors. (D) Low magnification image of E-cadherin expression in grade 2 tumors. Low magnification ×100.

