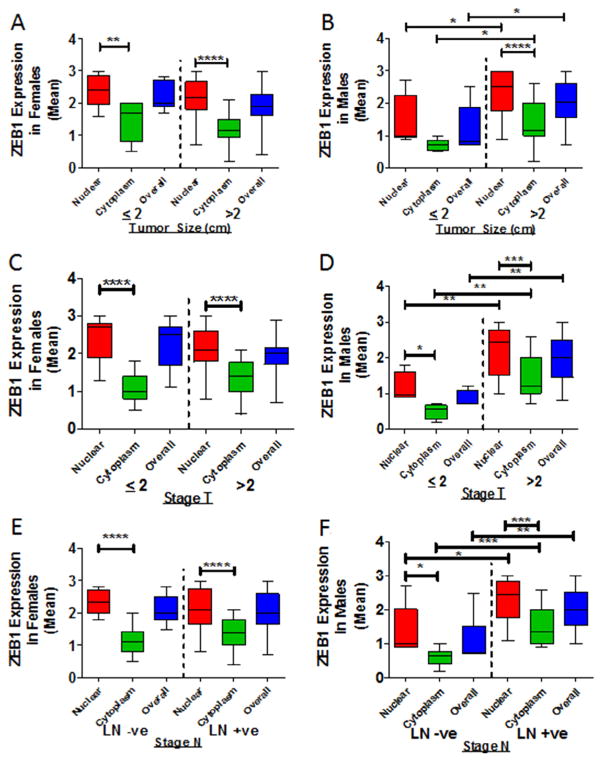
Fig. 5.
Subcellular localization of ZEB1 in PDACs. Expression of cytoplasmic and nuclear ZEB1 was assessed in tumors ≤2 or ≥2 cm in size. (A) For tumors of females, there was no appreciable elevation in expression of cytoplasmic or nuclear ZEB1. (B) For males, high-grade tumors >2 cm in size showed high nuclear (P = 0.0298), cytoplasmic (P = 0.0441) and overall (P = 0.0369) expressions of ZEB1. (C) Stage T tumors of females did not demonstrate a significant difference in expression of ZEB1. (D) For males, Stage T tumors ≥2 cm in size showed elevated expression of ZEB1 in the cytoplasm (P = 0.05), in the nucleus (P = 0.041), and overall (P = 0.014). (E) In lymph node-positive relative to lymph node-negative patients, tumors of females did not demonstrate a significant difference in expression of ZEB1. (F) Lymph node-positive compared to lymph node-negative tumors of males demonstrated elevated expression of ZEB1 in the cytoplasm (P = 0.0001), in the nucleus (P = 0.0012), and overall (P = 0.0002). LN+ve, lymph node positive; LN−ve, lymph node negative. *P < 0.05 is significant. **P < 0.01 is significant. ***P < 0.001 is significant.

