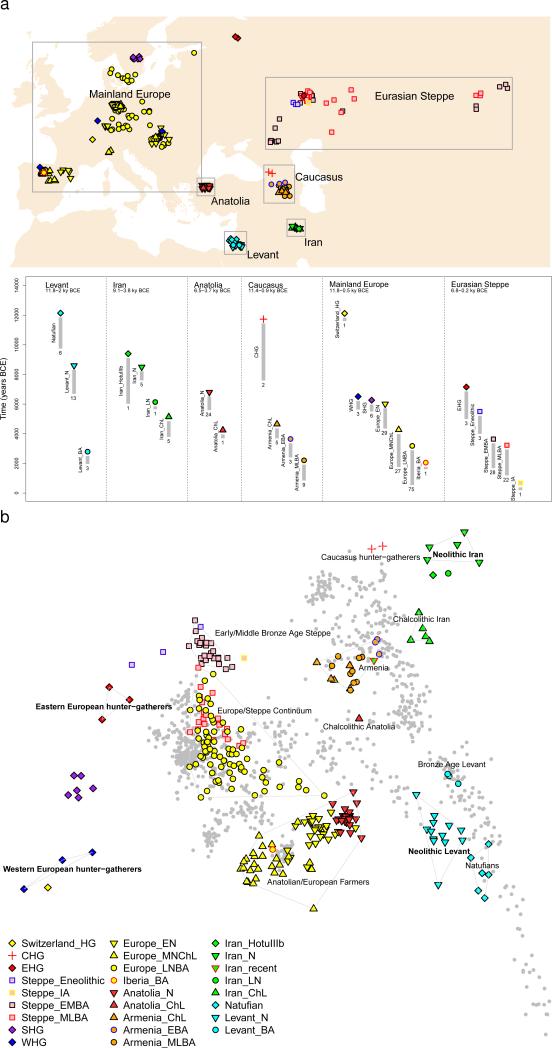
Figure 1. Genetic structure of ancient West Eurasia.
(a) Sampling locations and times in six regions. Sample sizes for each population are given below each bar. Abbreviations used: E: Early, M: Middle, L: Late, HG: Hunter-Gatherer, N: Neolithic, ChL: Chalcolithic, BA: Bronze Age, IA: Iron Age. (b) Principal components analysis of 991 present-day West Eurasians (grey points) with 278 projected ancient samples (excluding the Upper Paleolithic Ust’-Ishim, Kostenki14, and MA1). To avoid visual clutter, population labels of present-day individuals are shown in Extended Data Fig. 1.

