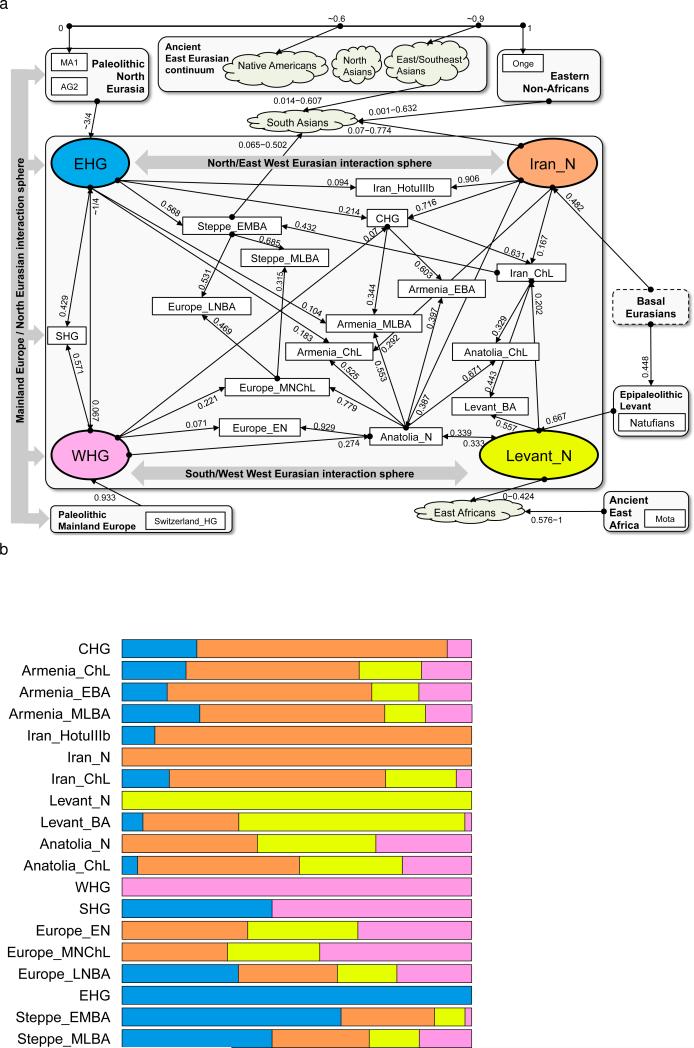
Figure 4. Modelling ancient West Eurasians, East Africans, East Eurasians and South Asians.
(a) All the ancient populations can be modelled as mixtures of two or three other populations and up to four proximate sources (marked in colour). Mixture proportions inferred by qpAdm are indicated by the incoming arrows to each population. Clouds represent sets of more than one population. Multiple admixture solutions are consistent with the data for some populations, and while only one solution is shown here, Supplementary Information, section 7 presents the others. (b) A flat representation of the graph showing mixture proportions from the four proximate sources.

