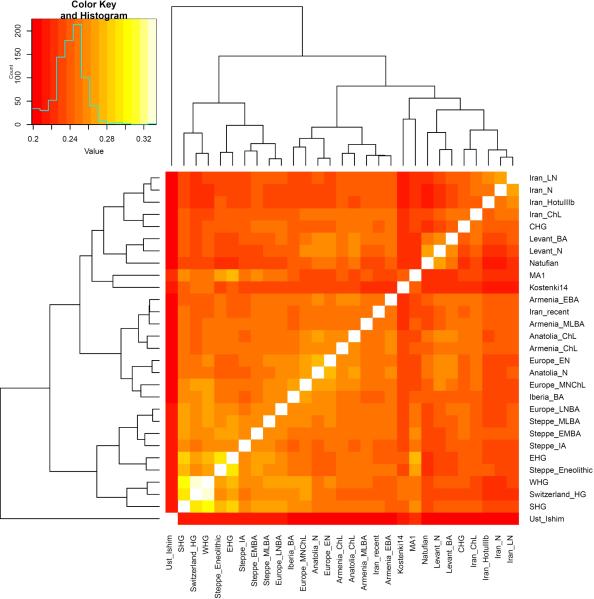
Extended Data Figure 3. Outgroup f3(Mbuti; X, Y) for pairs of ancient populations.
The dendrogram is plotted for convenience and should not be interpreted as a phylogenetic tree. Areas of high shared genetic drift are ‘yellow’ and include from top-right to bottom-left along the diagonal: early Anatolian and European farmers; European hunter-gatherers, Steppe populations and ones admixed with steppe ancestry; populations from the Levant from the Epipaleolithic (Natufians) to the Bronze Age; populations from Iran from the Mesolithic to the Late Neolithic.

