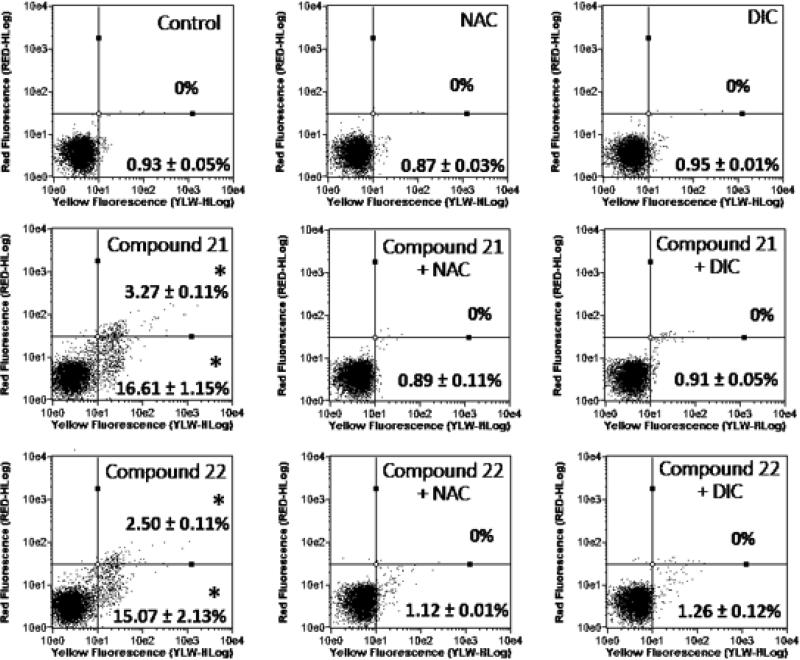
Figure 3.
Effect on phosphatidylserine externalization after 6 h-treated PC3 with 5 μM of tested compounds. The phosphatidylserine externalization was determined by flow cytometry using AnnV-FITC (YLW-HLog) and PI (RED-HLog). Viable cells are plotted at lower left quadrant, cells in early and late apoptosis with phosphatidylserine externalized are plotted at lower right and upper right quadrants, respectively, and necrotic cells are plotted at upper left quadrant. *p < 0.05 compared to control by ANOVA followed by Newman-Keuls test. Data are presented as mean values ± S.E.M. from three independent experiments in triplicate.

