
Figure 3.
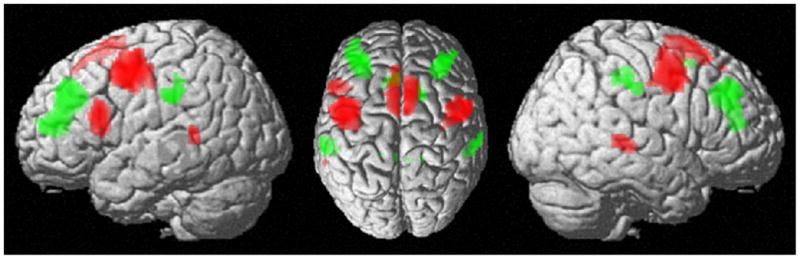
Specific conjoint RS functional connectivity of lateral FEF and SEF (in red) and medial FEF and aMCC (in green). That is, regions depicted in red revealed increased FC with the lateral vs. medial FEF as well as increased FC with SEF vs. aMCC. Likewise, regions shown in green revealed increased FC with medial vs. lateral FEF as well as with aMCC vs. SEF.