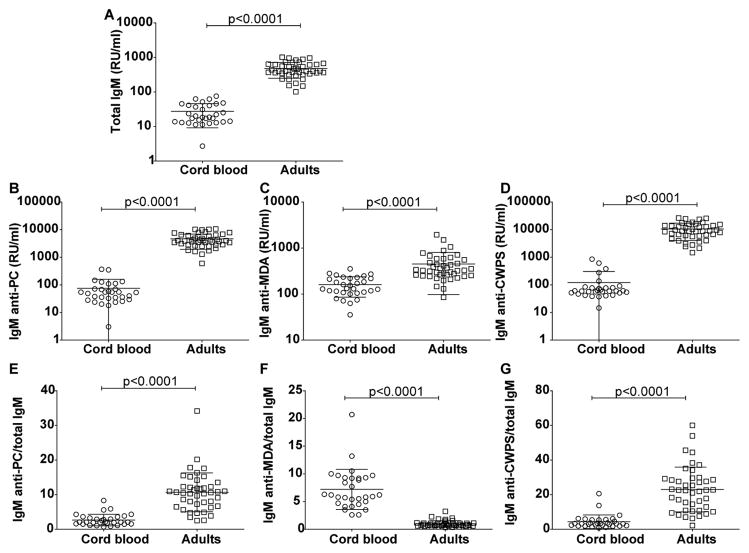
Figure 1. Levels of IgM in newborn and adult blood samples.
Analysis of IgM levels in 31 cord blood samples compared to 43 healthy adults. Panels depict results from ELISA immunoassays for; Total IgM (A) or IgM that recognize: phosphorylcholine (PC) (B); malondialdehyde (MDA) protein adducts (C); pneumococcal cell wall polysaccharide, CWPS (D). Panels (E)–(G) illustrate the ratios of IgM anti-PC/total IgM, IgM anti-MDA/total IgM and IgM anti-CWPS/total IgM. Binding assays were performed by ELISA. P-values were derived from two-sided un-paired t test with Welch’s correction.

