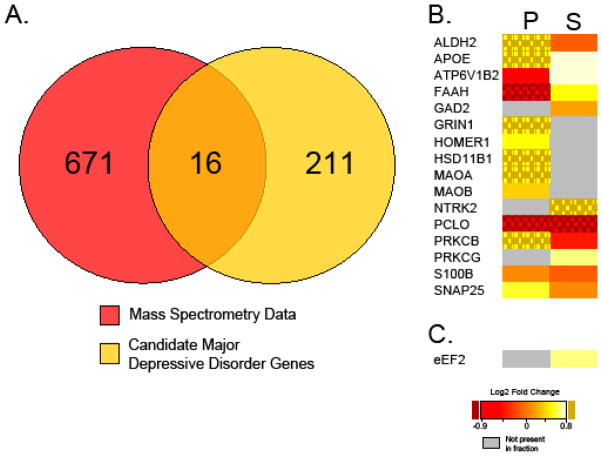
Figure 3. Protein expression regulated by mTORC1 activity overlap with depression.
(A) Venn diagram illustrating several proteins identified by mass spectrometry of synapses with brief in vivo mTORC1 inhibition overlap with proteins associated with depression. (B) Heat map of 16 overlapping proteins in the postsynaptic density fraction (P) and soluble fraction (S) of synaptoneurosomes isolated from cortices of control and rapamycin injected rats. Note, many of those proteins increase with mTORC1 inhibition (yellow). (C) Heat map of EEF2, demonstrating increased expression in soluble fraction of synaptoneurosomes with brief mTORC1 inhibition. Data obtained from Niere et al., 2015 and (Aragam et al., 2011; De Vry et al., 2016; Dekker et al., 2012; Dlugos et al., 2009; Fatemi et al., 2001; Galeotti and Ghelardini, 2011; Gatt et al., 2015; Gray et al., 2015; Lee et al., 2010b; Liu et al., 2015; Luo et al., 2010; Ogawa and Kunugi, 2015; Ray et al., 2014; Rietschel et al., 2010; Sakaida et al., 2013; Shyn et al., 2011; Skoog et al., 2015; Stachowicz et al., 2015; Tadic et al., 2007; Unschuld et al., 2009; Wagner et al., 2015; Yoshimasu et al., 2015) for bioinformatics analysis.

