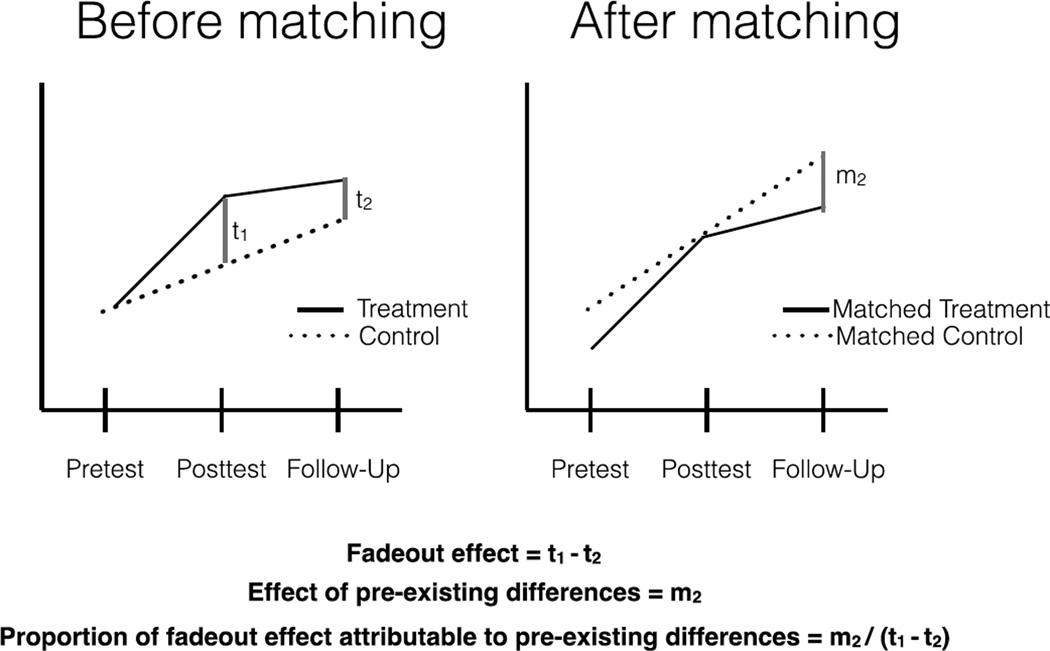
Figure 2. Graphical Representation of Calculations of the Fadeout Effect and Effect of Pre-Existing Differences.
The first graph in the left panel displays differences between the treatment and control children before they were matched. The difference between the treatment children and control children at post-test (represented by t1) is larger than the difference at follow-up (represented by t2). The fadeout effect is can be found by taking the difference between the two time points. The second graph in the right panel displays the trajectories of children’s achievement once they have been matched. Children who were matched to be in the control group outperformed children who were matched to be in the treatment group. The difference between the two groups at follow-up (represented by m2) is the effect of children’s pre-existing differences. The proportion of the fadeout effect attributable to pre-existing differences can be calculated by dividing the effect of pre-existing differences by the fadeout effect.

