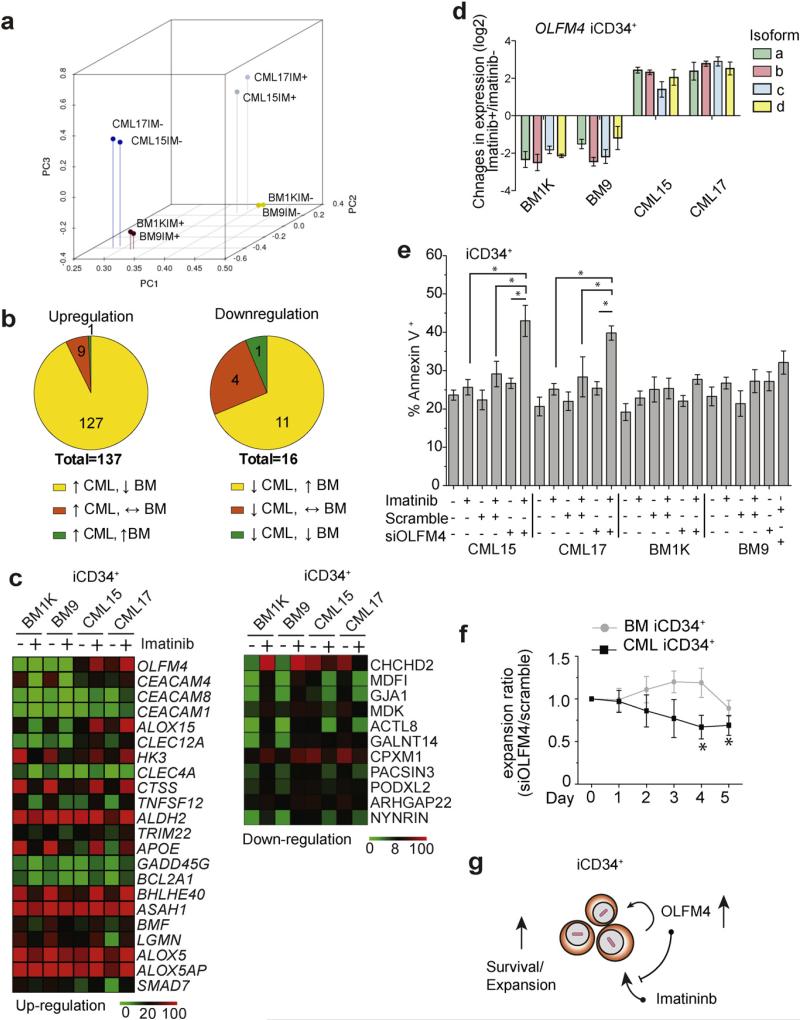
Fig. 4.
Gene expression analysis reveals set of imatinib-induced genes in CML iPSC-derived iCD34+ cells. (a) Principal component (PC) analysis of global gene expression in iCD34+ cells treated (IM+) and non-treated (IM−) with imatinib. After treatment with imatinib the position of CML iCD34+ cells shifted toward normal non-treated BM iCD34+ cells. (b) Selection of candidate genes associated with imatinib resistance. Upper left Venn diagram shows genes significantly upregulated by imatinib in CML iCD34+(≥2 fold induction). Upper right Venn diagram shows genes that were significantly suppressed by imatinib (≥2 fold reduction). Genes with tpm < 10 across all studied samples were excluded from analysis. (c) Heat maps showing expression of genes selectively induced or suppressed by imatininb in CML iCD34+. The top differentially expressed genes are arranged based on ratio of expression in imatinib-treated CML/imatinib-treated BM iCD34+ cells. (d) qPCR analysis of the effect of imatinib treatment on expression of OLFM4 mRNA isoforms in CML and BM iCD34+ cells. The results are mean ± SEM of three experiments in duplicate. The expression levels were calculated relative to untreated control. (e) OLFM4 knockdown with siRNA induced apoptosis in imatinib treated CML iCD34+ cells. Results are mean ± SEM of three independent experiments. The statistical differences were only observed between CML iCD34+ samples treated with imatinib alone and imatinib plus siOLFM4; * p < 0.05 (f) Effect of OLFM4 knockdown on BM or CML iCD34+ cell proliferation in CSSM medium supplemented with growth factors. Graph displays the ratio of cell numbers in cultures treated with siOLFM4 relative to cell numbers in corresponding cultures treated with scrambled siRNA. Results are mean ± SEM of three independent experiments. * indicates significant (p < 0.05) decrease in the expansion cell ratios (siOLFM/scramble siRNA cultures) in CML iCD34+ cultures when compared to normal BM controls. (g) Summary of findings.

