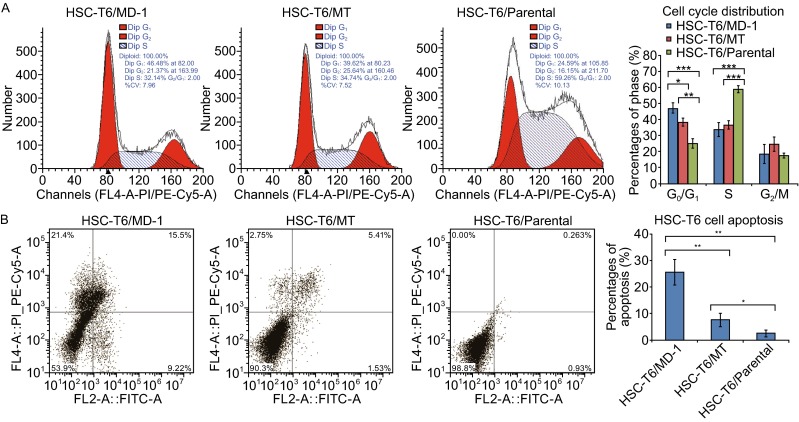
Figure 3.

Inhibition of cell cycle and induction of apoptosis by MD-1 in HSC-T6 cells. (A) Left: The cell cycle distribution of HSC-T6 cells in the presence of MD-1 or MT at 62 μmol/L was examined by flow cytometry. Right: Statistics for cell cycle distribution. *P < 0.05; **P < 0.01; ***P < 0.001. (B) Left: The cell apoptosis rate was detected with flow cytometer in MD-1, MT and control group. *P < 0.05; **P < 0.01; ***P < 0.001
