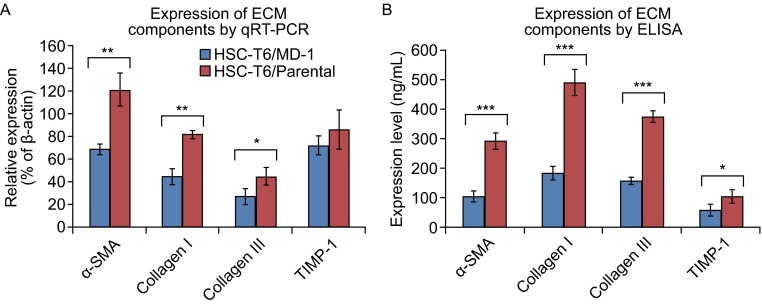
Figure 5.
Inhibitory effects of MD-1 on ECM synthesis and secretion in HSC-T6 cells. (A) Relative expression levels of ECM components, including α-SMA, collagen I and III, and TIMP-1, as detected by real-time quantitative PCR (qRT-PCR). *P < 0.05; **P < 0.01. (B) Expression of ECM components in the collected cell supernatant as determined by ELISA. *P < 0.05; ***P < 0.001

