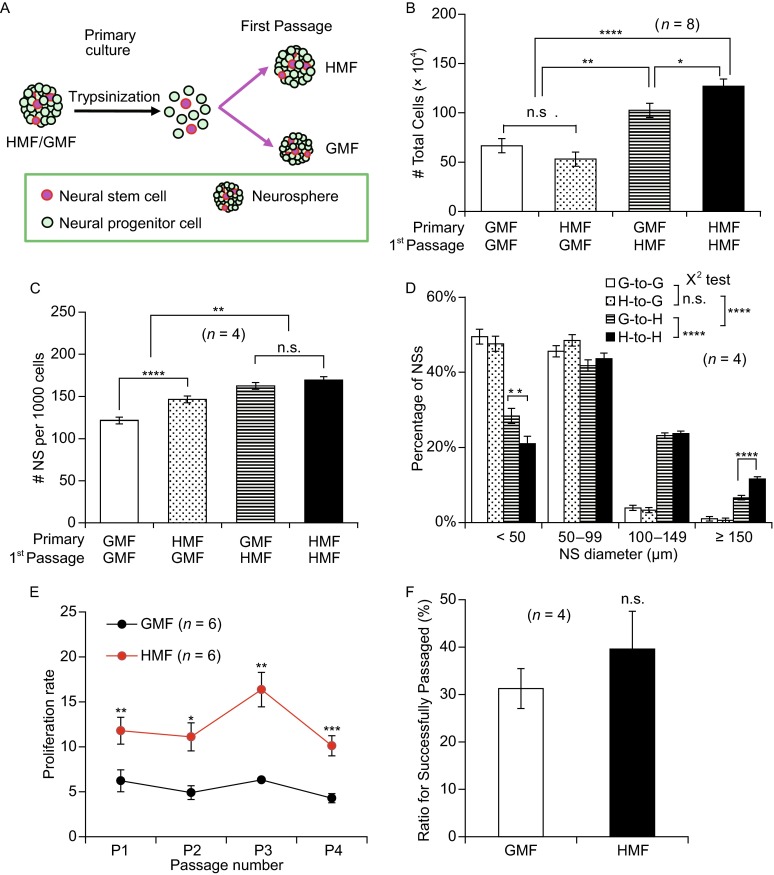
Figure 2.

Continued exposure is required for HMF-promoted growth of NSs. (A) A schematic of the GMF recovery experiment. Primary cultures from the HMF/GMF condition were trypsinized and exposed to either the HMF or GMF for the first-passage culture in either 60 mm dishes (1.0 × 10⁵ cells/dish for cell counting) or 96-well plates (1000 cells/well for NS counting and size analysis). (B) Numbers of NSs per 1000 seeded cells at day 6. 1000 cells from the HMF-exposed NSs (H-to-G) formed more NSs than the control cells (G-to-G), but the cells growing in HMF condition (G-to-H, H-to-H) formed more cells than these in the GMF condition (G-to-G, H-to-G). (C) Total cell numbers of first passage in the 6th day. More cells were yielded from the NSs growing under the HMF condition than these under the GMF condition, while the cell numbers were similar in the same condition. (D) NS size distributions at day 6. Compared to the NSs in the GMF, the growth of these NSs in the HMF was enhanced. The distributions of NSs size were similar between two GMF groups (G-to-G, H-to-G), while more large NSs and less small NSs were observed in the H-to-H than these in the G-to-H. (E) When HMF-exposed cells from the primary cultures were continuously passaged under the HMF condition (seeded at 1.0 × 10⁵ cells/60 mm dish), they were also seeded in the GMF as controls. NSs maintained a significantly higher proliferation rates in the HMF condition in four passages. (F) The ratio of successfully passaged large NSs (diameter ≥ 150 μm) in single clone culture assays showed no significant difference between the two conditions. n is the numbers of experimental trials. Data are shown as mean ± SEM in (B–E), or mean ± SD in (F). P values were calculated using a one-way ANOVA in (B–E), and using a χ2 test for NS size distribution in (D), and two-tailed paired student’s t-text in (F). *P < 0.05; **P < 0.01; *** P < 0.001; ****P < 0.0001; n.s. P ≥ 0.05
