Fig. 3.
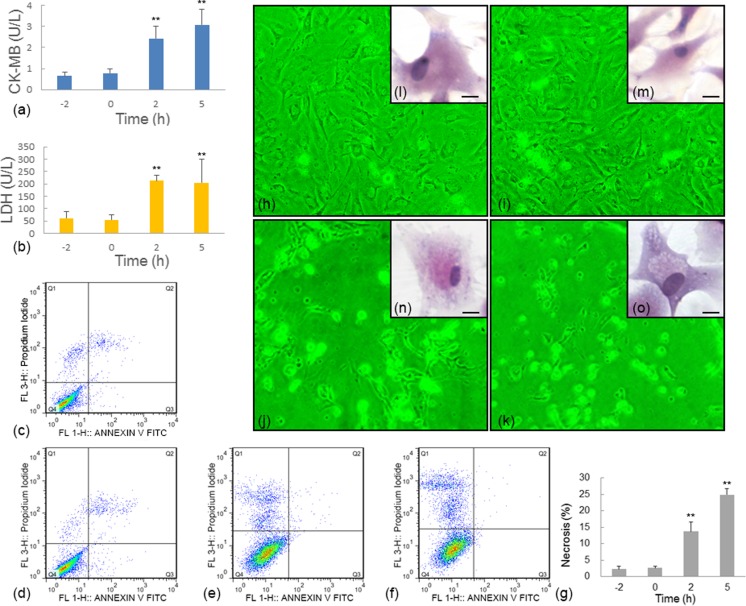
HS damage in group A + B was reflected by the activities of myocardial cell damage-related enzymes (CK-MB and LDH), cytopathological observations, and flow cytometry results. a, b Variation in CK-MB (a) and LDH (b) activities in group A + B. c–f Flow cytometry results for myocardial cells with Annexin V FITC and PI staining in group A + B at various time points: −2 (c), 0 (d), 2 (e), and 5 h (f). The X-axis is Annexin V FITC, and the Y-axis is PI. g Rates of necrosis at different time points in group A + B. h–k Representative contrast microscopy images (×40) for group A + B at −2 (h), 0 (i), 2 (j), and 5 h (k). l–o Representative images of hematoxylin and eosin (H&E) staining of myocardial cells in group A + B at −2 (l), 0 (m), 2 (n), and 5 h (o). Scale bar = 10 μm. Enzyme activity and flow cytometry data at 0, 2, and 5 h were compared with the baseline level (−2 h). **P < 0.01; *P < 0.05

