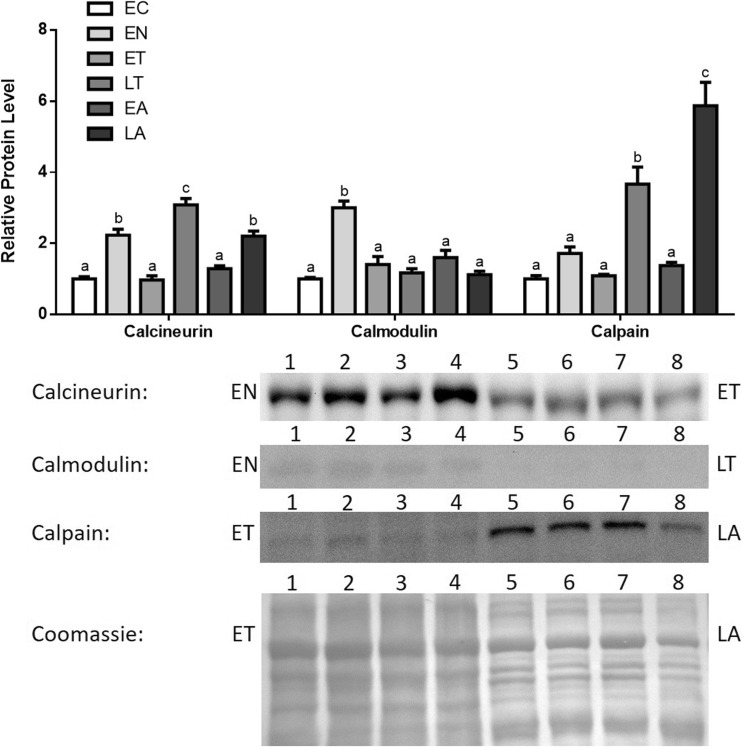
Fig. 2.
Changes in calcineurin, calmodulin, and calpain1 total protein levels in skeletal muscle over the torpor-arousal cycle in I. tridecemlineatus. Calcineurin, calmodulin, and calpain1 total protein expression levels were visualized at the six sampling points: euthermic cold (EC), entrance (EN), early torpor (ET), late torpor (LT), early arousal (EA), and late arousal (LA). See “Materials and methods” section for more extensive definitions of the sampling points. Westerns blots and Coomassie total protein loading controls representative of the results are shown for pairs of selected time points, which are labeled to the left and right of the immunoblot picture. Lane numbers labeled along the top indicate replicates (n = 4) of one sample (e.g., for calcineurin: EN lanes 1, 2, 3, and 4) and four of another sample (e.g., for calcineurin: ET lanes 5, 6, 7, and 8). Also shown are histograms with mean standardized band densities (±S.E.M., n = 4 independent protein isolations from different animals). Data was analyzed using a one-way analysis of variance with a post hoc Tukey’s test (p < 0.05); for each parameter measured, values that are not statistically different from each other share the same letter notation

