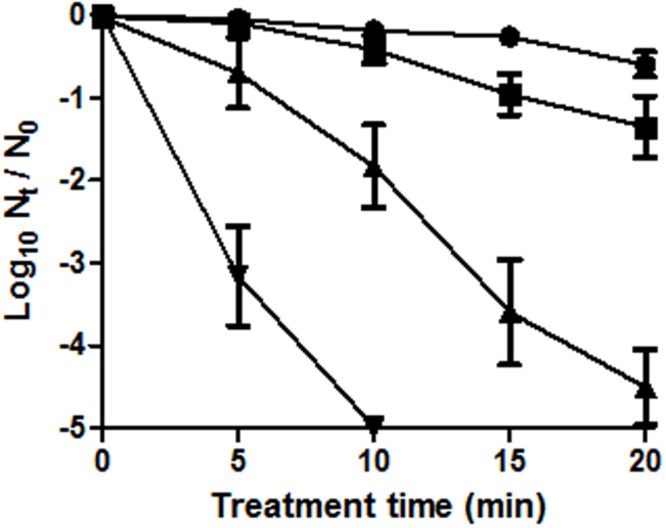
FIGURE 1.

Survival curves of Escherichia coli BW25113 (initial concentration: 108 CFU/mL) to a heat treatment at 55°C in M9 broth for different treatment times. E. coli cells were cultured in M9 agar (non-selective agar) (●) or M9 agar supplemented with 1 (■), 2 (▲), or 3% (▼) NaCl. Error bars represent standard deviation of the mean from three replicates.
