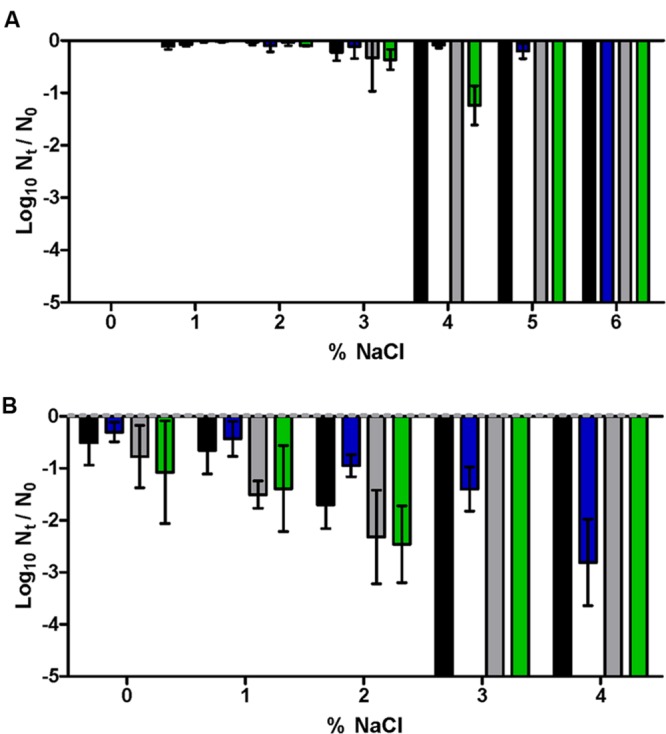
FIGURE 2.

Log10 cycles of survival fractions of untreated (A) or treated for 10 min at 55°C in M9 broth (B) of E. coli BW25113 WT (black, blue bars) or ΔproP (gray, green bars) after incubation in the absence (black, gray bars) or presence (blue, green bars) of betaine 1 mM in the M9 agar of different NaCl concentrations. Error bars represent standard deviation of the mean from three replicates.
