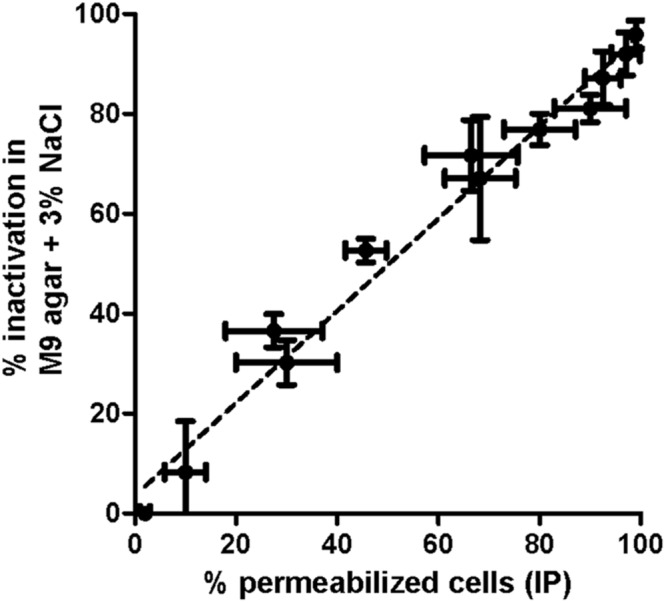
FIGURE 6.

Correlation and linear regressions between percentage of permeabilization of E. coli BW25113 cells after PI staining (measured in fluorescence microscope) and the proportion of inactivated cells (measured by plate count in M9 agar containing 3% NaCl). Thermal treatments at 55°C of different durations (0–3 min) were applied in M9 broth to obtain a variety of samples. Error bars represent standard deviation of the mean from three replicates.
