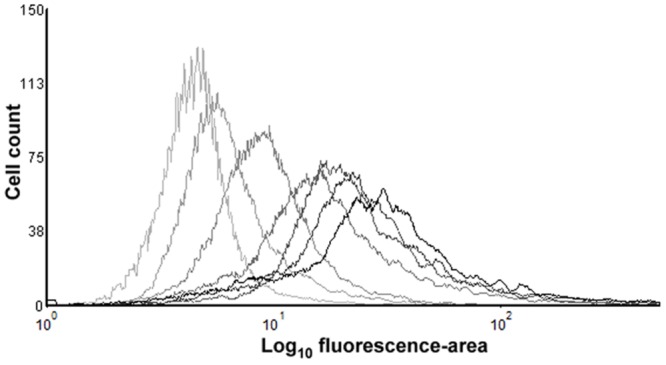
FIGURE 7.

Fluorescence histogram overlays obtained by flow cytometry measurement of PI-stained E. coli BW25113 cells of untreated cells and after thermal treatments at 53°C. Each overlay represents the frequency distribution of the fluorescence intensity (fluorescence-area values) of a total of 10000 events per sample, corresponding to the untreated sample (lighter overlay), or samples treated for 2, 4, 6, 10, 16, or 20 (darker overlay) min. Results shown from a representative experiment repeated three times with similar results.
