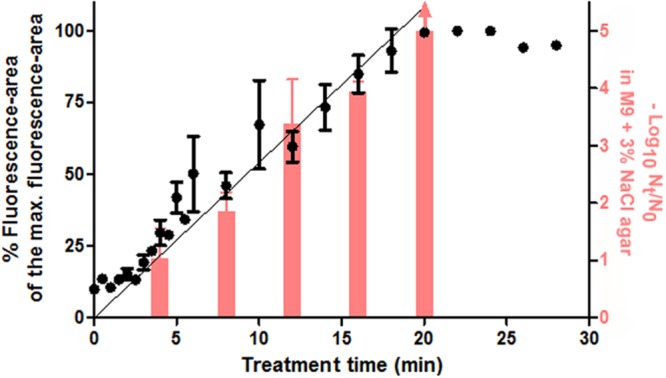
FIGURE 8.

Median values (●) of the fluorescence-area values obtained from single cell-flow cytometry from PI-stained cells and their linear regression lines, plotted against each duration of the thermal treatment at 53°C. The graph also shows the log10 cycles of inactivation (-log10 cycles of the survival fractions) as measured in M9 agar with 3% NaCl (red bars, corresponding to right Y-ax). Error bars represent standard deviation of the mean from three replicates.
