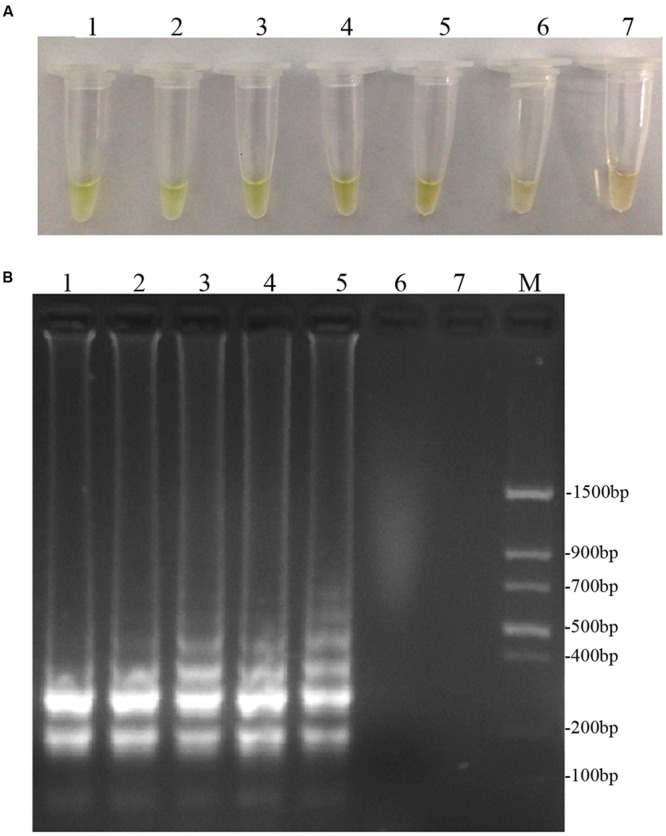
FIGURE 3.

Optimal reaction temperatures of LAMP. (A) Detecting LAMP products by adding fluorescence metal indicator (calcein); the assessment was based on visualization of a color change from brown to yellowish-green. (B) Agarose gel electrophoresis analysis of the LAMP products. In (A,B), lane 1: 61°C, lane 2: 62°C, lane 3: 63°C, lane 4: 64°C, lane 5: 65°C, lane 6: 66°C, lane 7: 68°C. M: Trans DNA Marker II (Transgen Biotech, Beijing). The same results were obtained in all three replicates.
