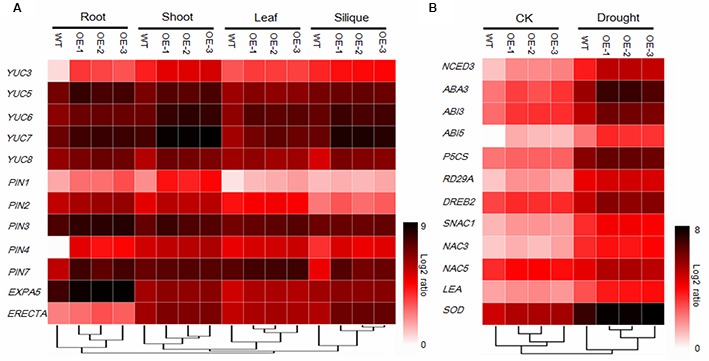
FIGURE 6.

Gene expression analysis of 12 development-related genes (A) and 12 stress-related genes under normal (CK) and drought stress conditions (B) using 384-well block high-throughput qRT-PCR. Relative transcript levels after normalization to reference gene tubulin8. Values are the mean of three independent experiments and expressed as log2 ratios relative to expression in WT, results shown as a heat map. Gene expression profiles were organized by hierarchical clustering.
