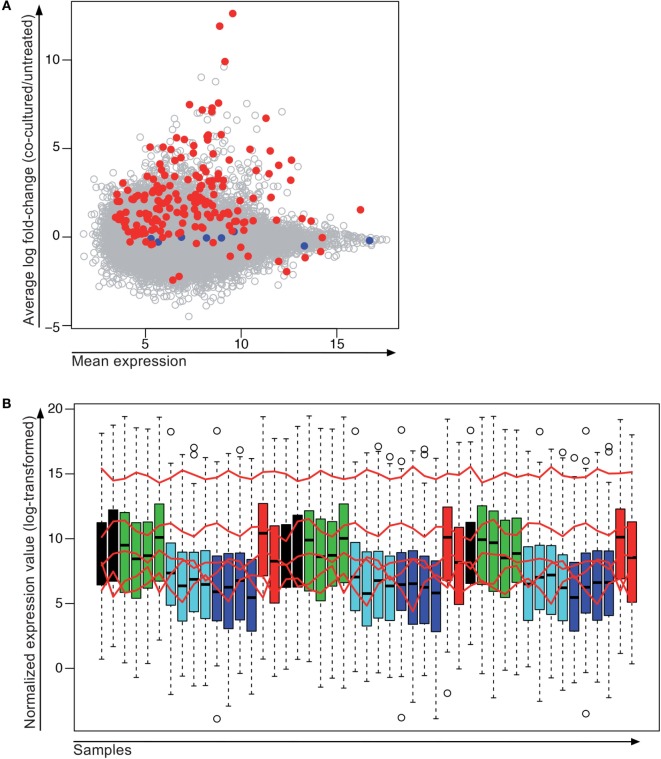
Figure 6.
Stably expressed genes detected by microarray and NanoString. (A) 185 genes with different expression levels were chosen for quantification by NanoString. Shown is the average expression measured by microarray from all samples on the x-axis and the average log fold-change between the co-cultured and the non-co-cultured samples across the three melanoma cell lines (Me290, Me275, and T1185B) on the y-axis. For the planned NanoString, the normalization genes (blue) were chosen to span a wide range of expression values but without changes between the treated and untreated cell lines. Red dots, genes selected for NanoString; blue dots, normalization genes for NanoString; gray dots, genes that were only measured by microarray. (B) Normalized gene expression values of all samples analyzed by NanoString. Red lines indicate expression levels of genes used for normalization (order from highest to lowest expression: RPLP0, GUSB, ALG12, ADAT2 and KRBA2). Treatment color code: Black, MelanA-specific clone 1; green, cytokines; cyan, negative control CTLs; blue, untreated; red, MelanA-specific Clone 121. Samples are shown in the same order as they were run on the NanoString cartridge.

