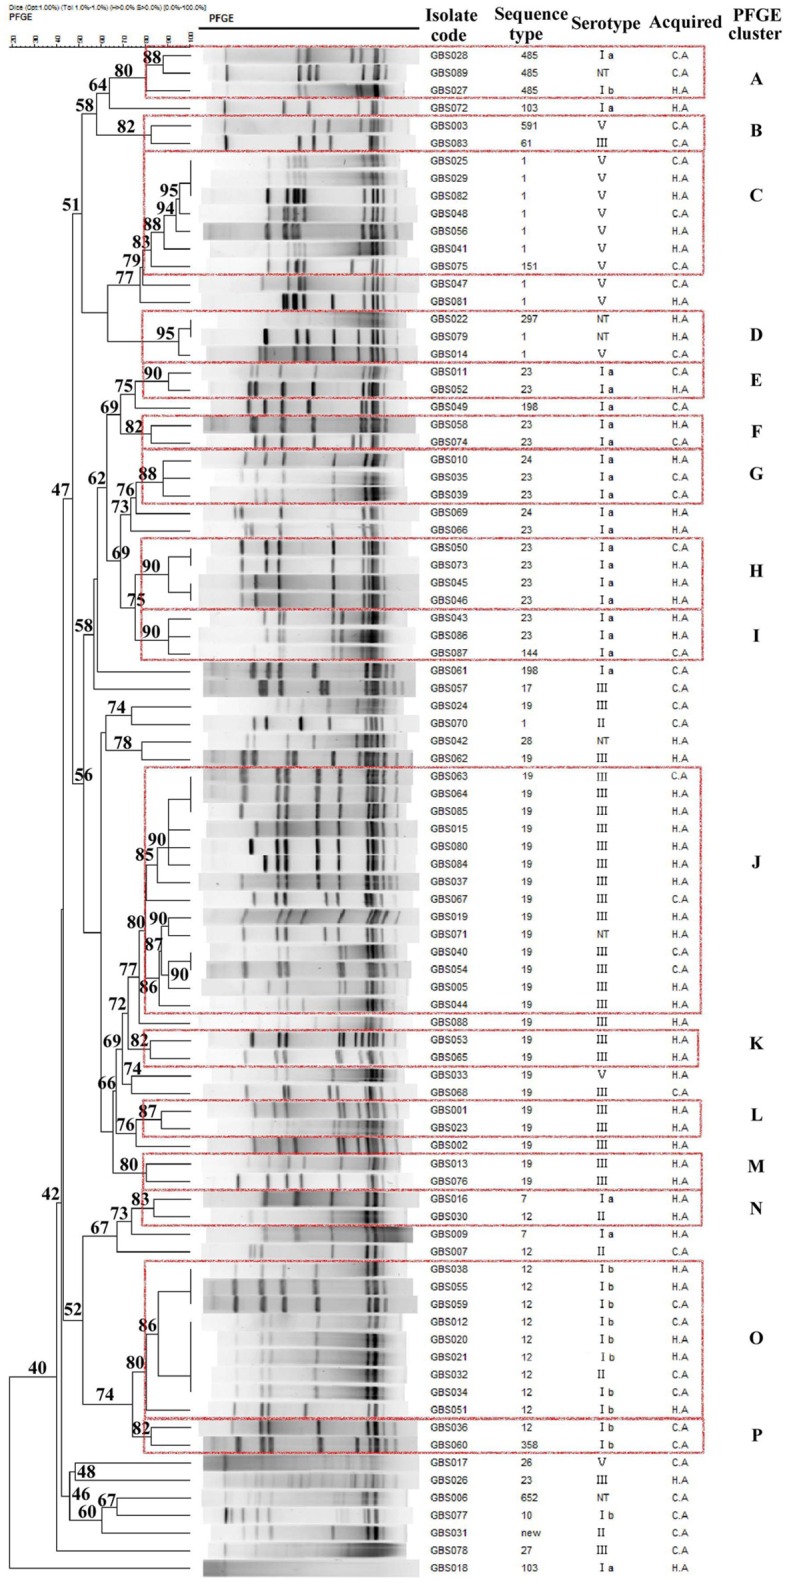
Figure 2.

Dendrogram of the PFGE profiles of 87 GBS isolates. The dendrogram was constructed using the UPGMA method. Dice coefficients (percentages) are indicated in the scale above the dendrogram. Each cluster (defined as a group of two or more isolates with a Dice coefficient of ≥80%) is represented in the dendrogram.
