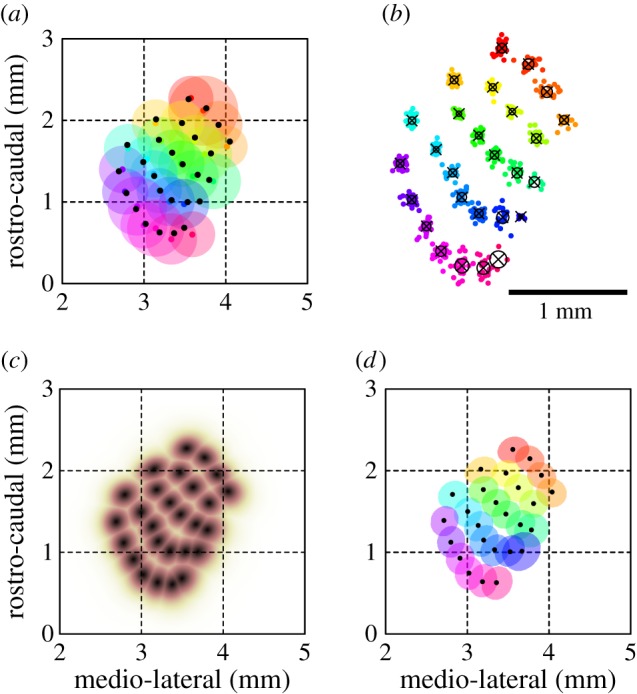
Figure 4.

Construction of a canonical map in the vS1 cortex. (a) Distributions of eIOS centroids, in absolute anatomical coordinates, represented by the mean (black dots) and standard deviation (circles colour coded by vibrissa identity) of the geometric position of eIOS centroids (541 vibrissae from 25 mice). (b) Distributions of eIOS centroids, in relative anatomical coordinates (629 vibrissae from 28 mice). The locations of map centroids obtained from the same mouse were maintained in fixed relative coordinates and rotated, translated and re-scaled to optimally match, in the least-squared sense, the location, scale, and orientation of centroids of a reference eIOS map (figure 3b). Centroids of individual eIOS maps are plotted and colour coded by vibrissae identity (as in panel (a)), and additionally represented by the average (black x's) and standard deviations (black circles) of their relative geometric positions. (c) Canonical somatotopic map of the vibrissa representation in the vS1 cortex. Individual eIOS maps were aligned as in part (b) and then averaged, according to vibrissa identity, across all 28 mice and combined through normalization and maximal projection to yield an average map in relative coordinates. This map was then transformed to absolute coordinates by finding the affine transform (in the least-squares sense) that matched the distribution of eIOS centroids in relative coordinates (x's in in panel (b)) onto the distribution of eIOS centroids in absolute coordinates (black dots in in panel (a)). The result shown is thus the combined eIOS map of all individual vibrissa, averaged across mice, at its average spatial location and orientation in absolute anatomical coordinates relative to bregma. We term this map the canonical map of vibrissa representation in the vS1 cortex. (d) Spatial locations of individual vibrissa representations in the vS1 cortex in terms of the centroids and half-widths of the eIOS of the canonical vibrissa map.
