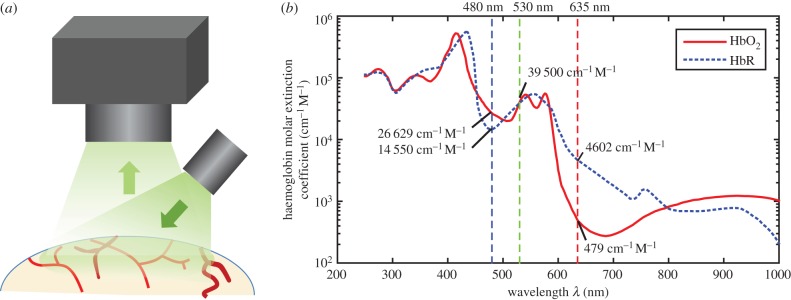
Figure 2.
Imaging geometry for WFOM (a) and absorption spectra of oxy- and deoxyhaemoglobin (HbO and HbR) (b). Vertical lines show common wavelengths for reflectance WFOM measurements. Raw data, reproduced from [26] is tabulated in the electronic supplementary material, appendix A.

