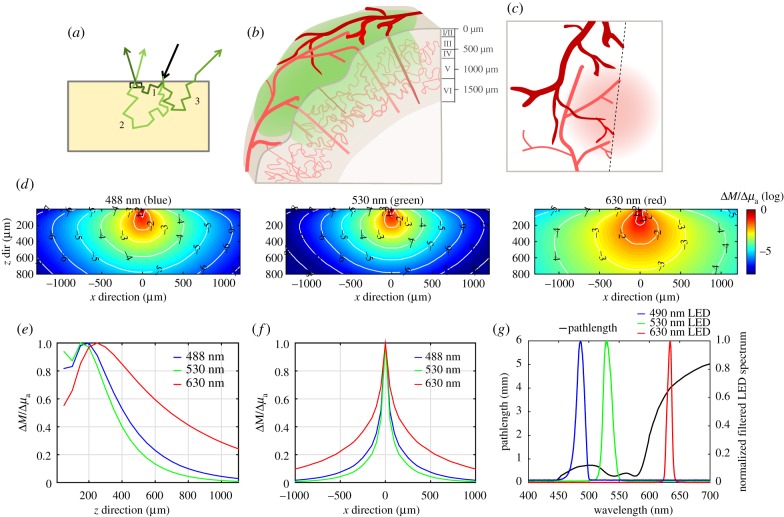
Figure 4.
The effects of scattering on spatial sensitivity and pathlength. (a) Depiction of light-scattering paths in diffuse reflectance. Photon 1 scatters shallowly and emerges close to the point of illumination. Photon 2 scatters more deeply, becomes less probable but is still detected. Photon 3 scatters and is not emitted within the NA of the detector. (b) The vascular architecture of the mouse cortex, where large arteries and veins cover the cortical surface, with diving arterioles feeding deeper capillary beds, which in turn are drained by ascending venules. WFOM illuminates the cortical surface, visualizing surface vessels with sharp contrast. Light penetrating more deeply is attenuated, but can report more blurred signals from capillary contributions as depicted in (c). (d) Shows Monte Carlo-based simulations of 488, 530 and 630 nm light, showing (y-averaged) spatial sensitivity of a camera pixel to changes in absorption at different depths and lateral positions (log10 scale on colour bar and contours). Properties: 488 nm: μa = 0.33 mm−1, μs = 21 mm−1, g = 0.8; 530 nm: μa = 0.55 mm−1, μs = 21 mm−1, g = 0.82; 630 nm: μa = 0.024 mm−1, μs = 24 mm−1, g = 0.87, values from [29], and assuming 3% blood in tissue and 75% average oxygen saturation. (e) Plot extracted from (d) showing the overall depth sensitivity of measurements at a single pixel (over all lateral positions) for the three wavelengths (linear scale) and (f) the lateral sensitivity measurements at a single pixel (over all depths). These plots show that red light can detect changes in much deeper tissues than green light (although this difference depends most strongly on absorption differences than scatter). (g) Simulated wavelength-dependent pathlength based on Monte Carlo simulations (methods and tabulated values included in the electronic supplementary material, appendix B). Measured spectra of blue, green and red LEDs with band-pass filters are overlaid. Pathlength values (and haemoglobin molar extinction values) used are integrated under these spectral curves for haemodynamic conversion. LEDs used: Thorlabs M490L3 (GCaMP excitation blue), M530L3 (green) and M625L3 (red). Filters used: Semrock FF01-530/43-25 (530/43 in front of the green) and FF01-475/28-25 (475/28 in front of the blue).

