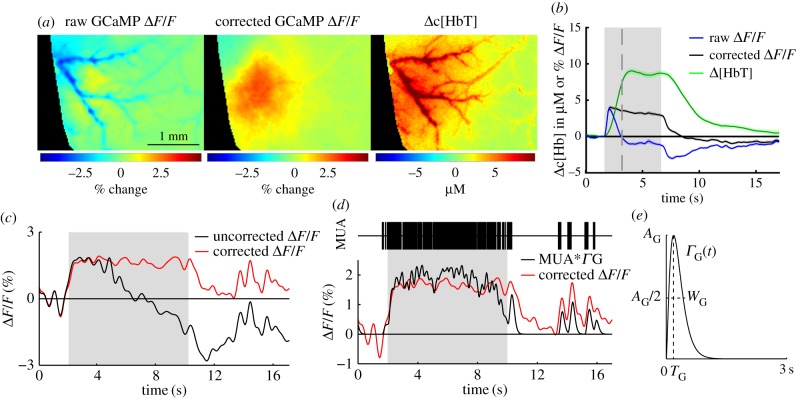
Figure 7.
Haemodynamic correction of WFOM GCaMP data and validation with electrophysiology. (a) Data shown in figure 1 before and after haemodynamic correction using the Ex–Em method. Maps are for 1.7 s after onset of a 5 s tactile whisker stimulus in an awake, behaving mouse (average of 38 trials). Corrected image shows only minor vessel artefacts, whereas original response is dominated by negative contrast corresponding to the haemodynamic response. (b) Time courses show the GCaMP signal before and after correction, in comparison with the D[HbT] haemodynamic response. (c) Raw uncorrected and single-wavelength ratiometrically corrected and GCaMP signals acquired in a urethane-anaesthetized Thy1-GCaMP3 mouse undergoing an 8 s electrical hindpaw stimulation. (d) An electrode inserted into the responding region recorded multi-unit activity (MUA). The GCaMP fluorescence signal after haemodynamic correction can be closely replicated by convolving MUA with a gamma function (e) to model the combined dynamics of intracellular calcium and GCaMP fluorescence changes.

