
Figure 4.
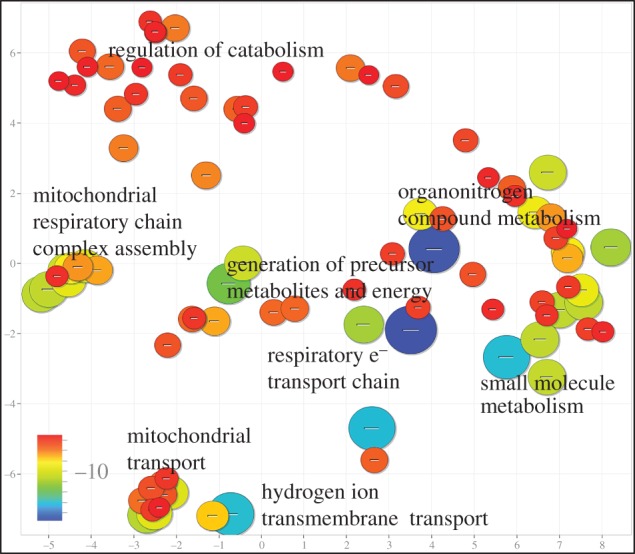
Enrichment analysis of PLS2 gene expression profile associated with long-distance connections and inter-modular hubs in fMRI networks. Significantly enriched GO terms are plotted in semantic space such that similar terms are represented close to one another. Markers are scaled and coloured according to the log10 of the p-value for the significance of each term. Large blue circles are highly significant (PFDR < 10−15), while small red circles are less so (PFDR < 0.001).